The national real estate market continued its recovery in the first half of 2023, rebounding dramatically from the slowdown in activity and price decline, which hit bottom in late 2022.
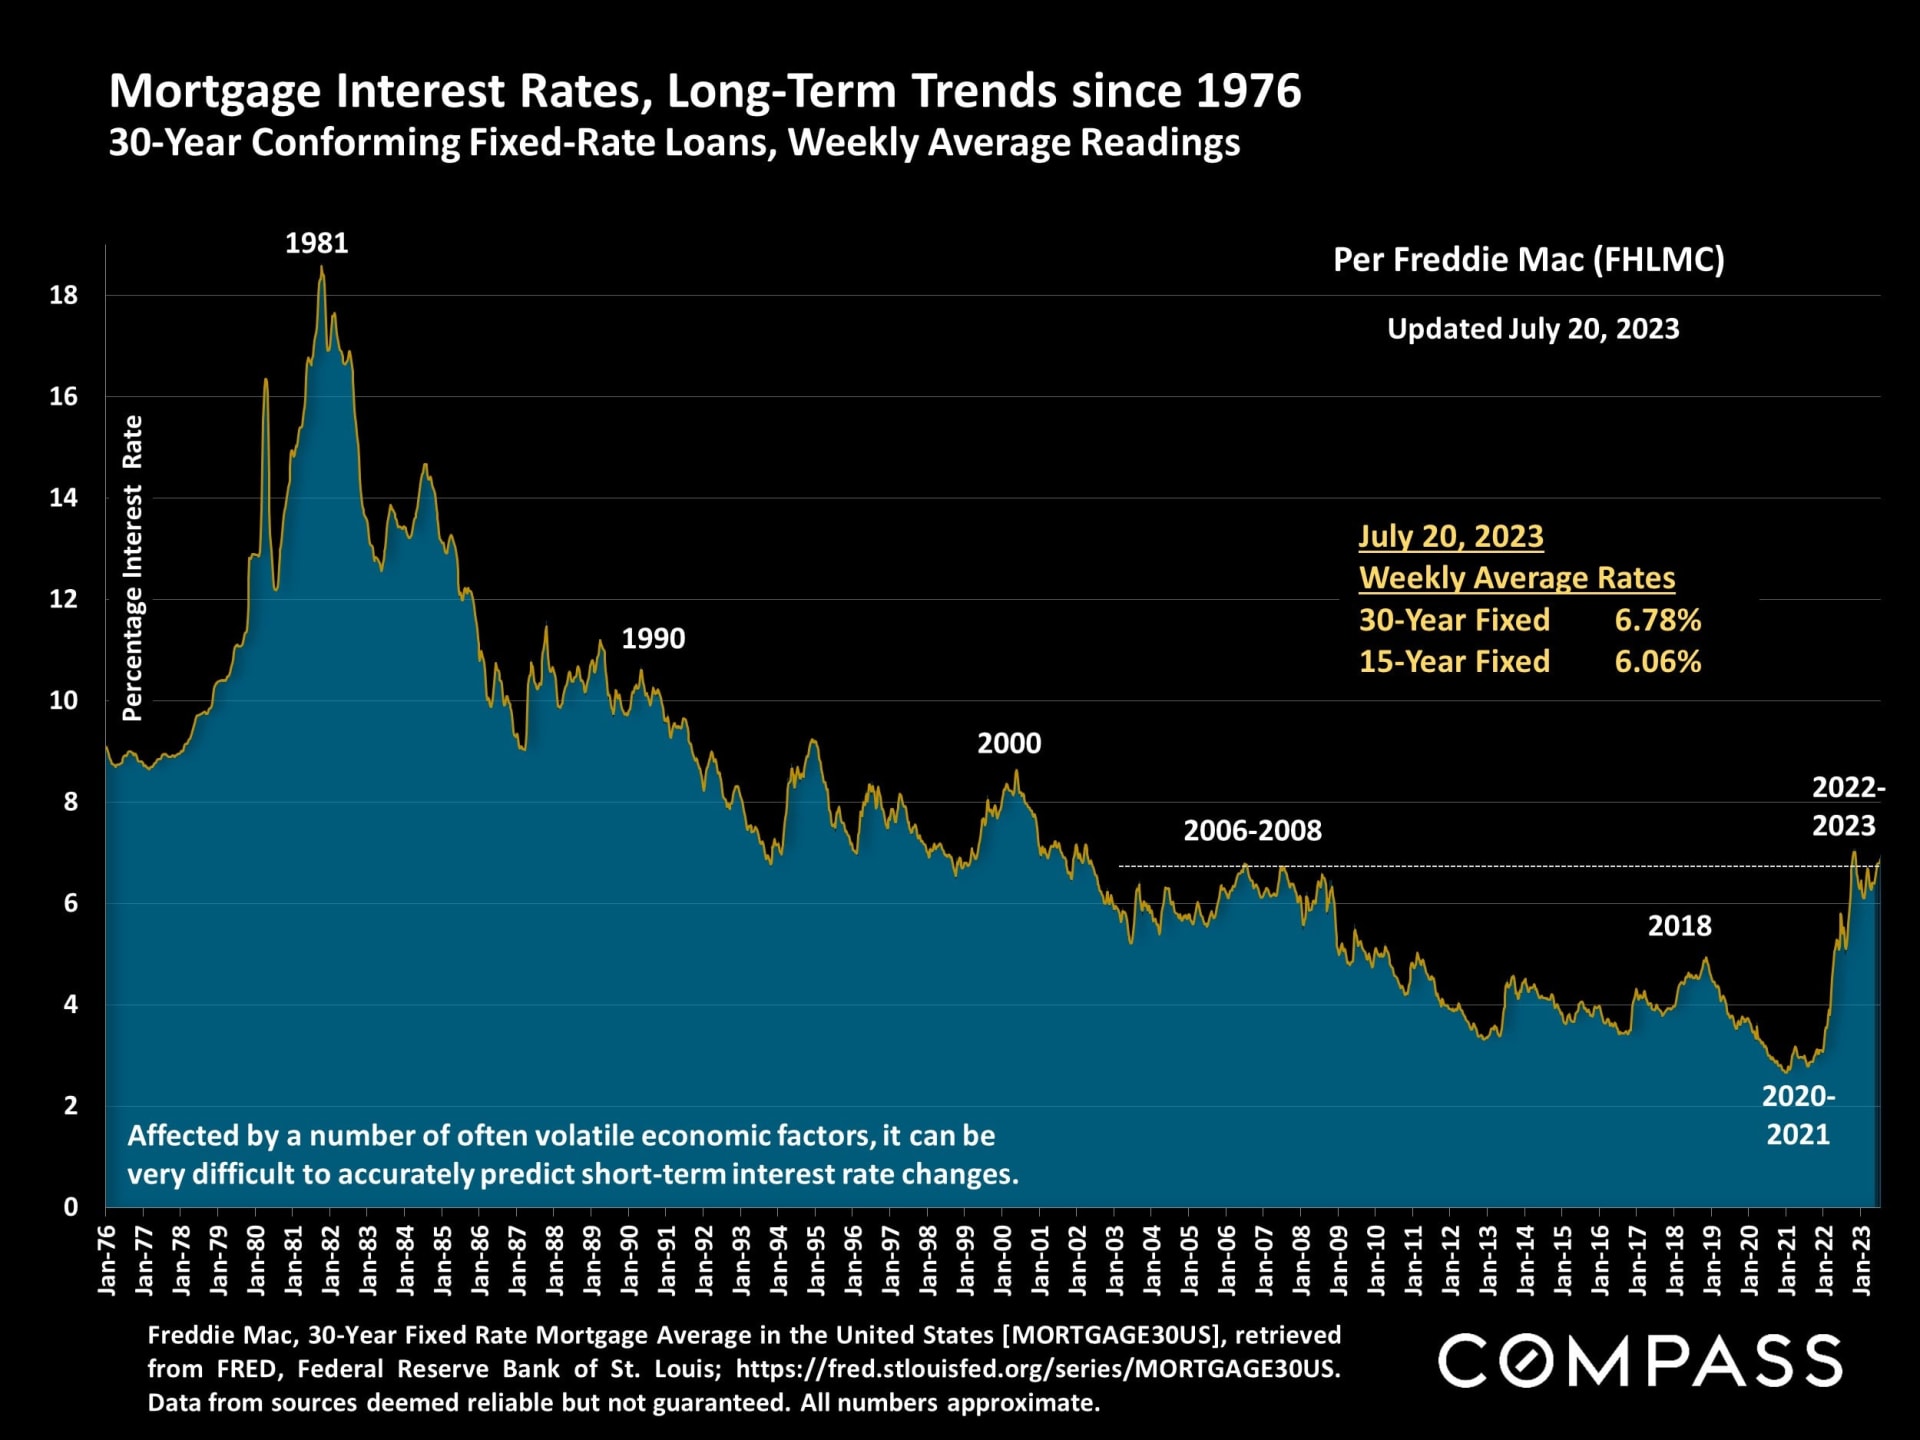
On the macroeconomic front, despite intermittent financial crises, indicators have generally turned distinctly positive: Substantial recoveries in stock markets, a significant decline in inflation, robust employment reports, and consumer confidence hitting its best reading since September 2021. Interest rates remain relatively high, commonly ranging between 6% and 7% this year, but to a large degree, it appears buyers have accepted these rates as the new normal - and a larger proportion of buyers have been paying all cash.
Buyer demand continued to climb through spring, but sales have been constrained by the steep decline in new listings coming on the market over the past 12 months, a decline generally ascribed to the "mortgage lock-in effect," i.e. a reluctance of homeowners with low-interest rate mortgages to sell and move. This has put upward pressure on home prices, as well as accelerating new-home construction as developers seek to take advantage of low-inventory conditions.
Ultimately, the market is defined by the balance between demand and supply, and in 2023, it has tilted increasingly to sellers' advantage, with homes selling faster, with more offers, for higher prices. Part of this is due to seasonal dynamics - spring is commonly the most active selling season of the year - but the change also reflects a rebound in psychology, with many buyers deciding to move forward with their life plans.
A national report is a huge generalization of broad trends across an enormous range of regional submarkets whose values and market dynamics vary. How the data illustrated here applies to a particular home is only known with a specific comparative market analysis.
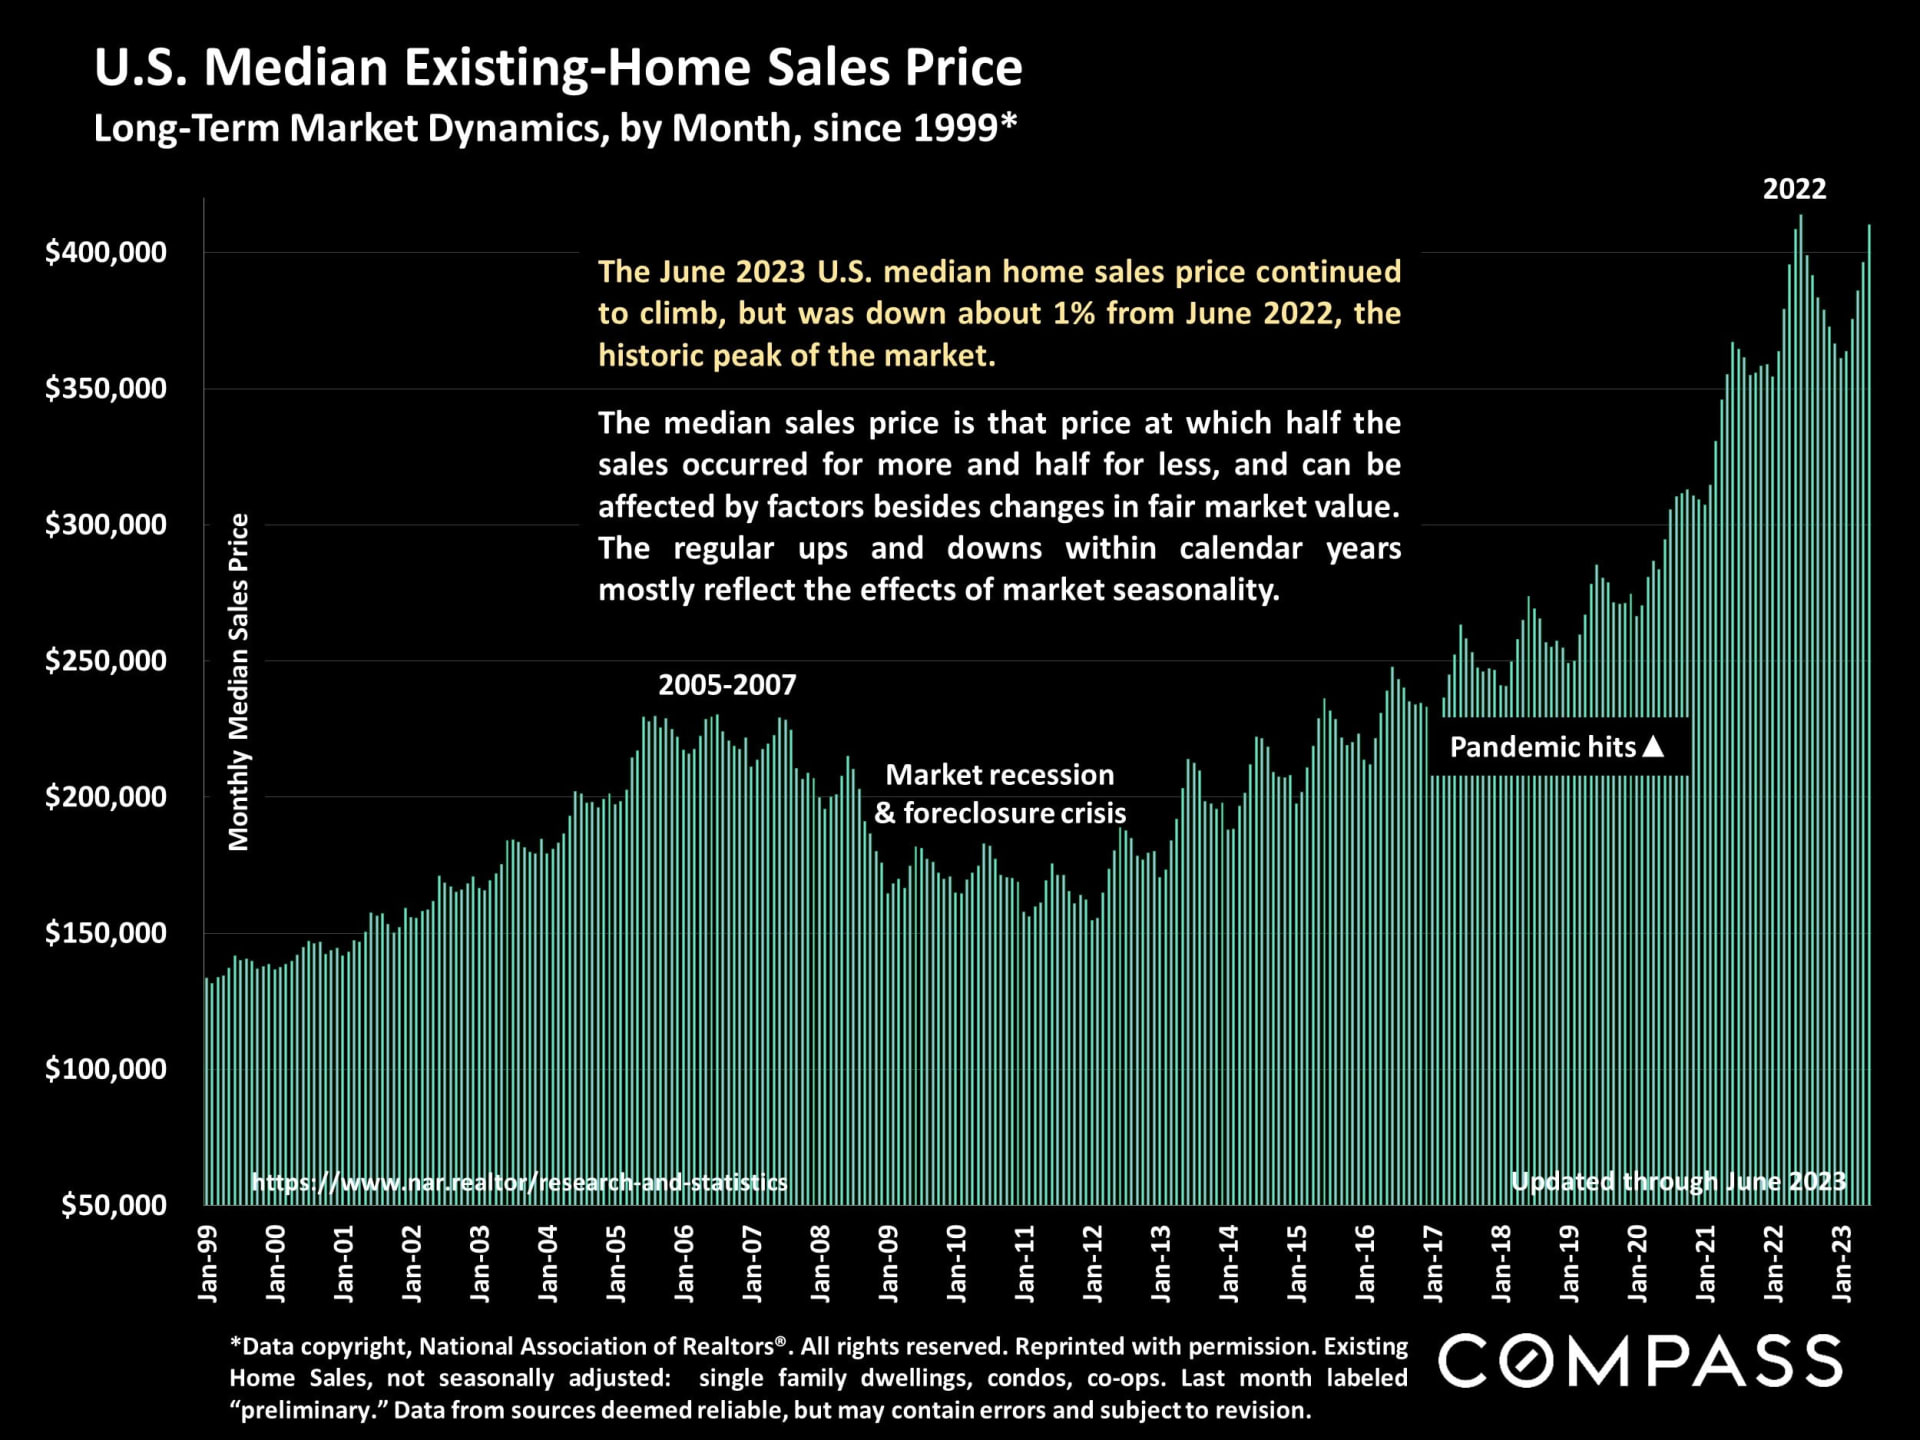
An illustration of long-term, national median home sales prices: The June 2023 price was just 1% lower than in June 2022, the historic peak of the market.
|
|
|
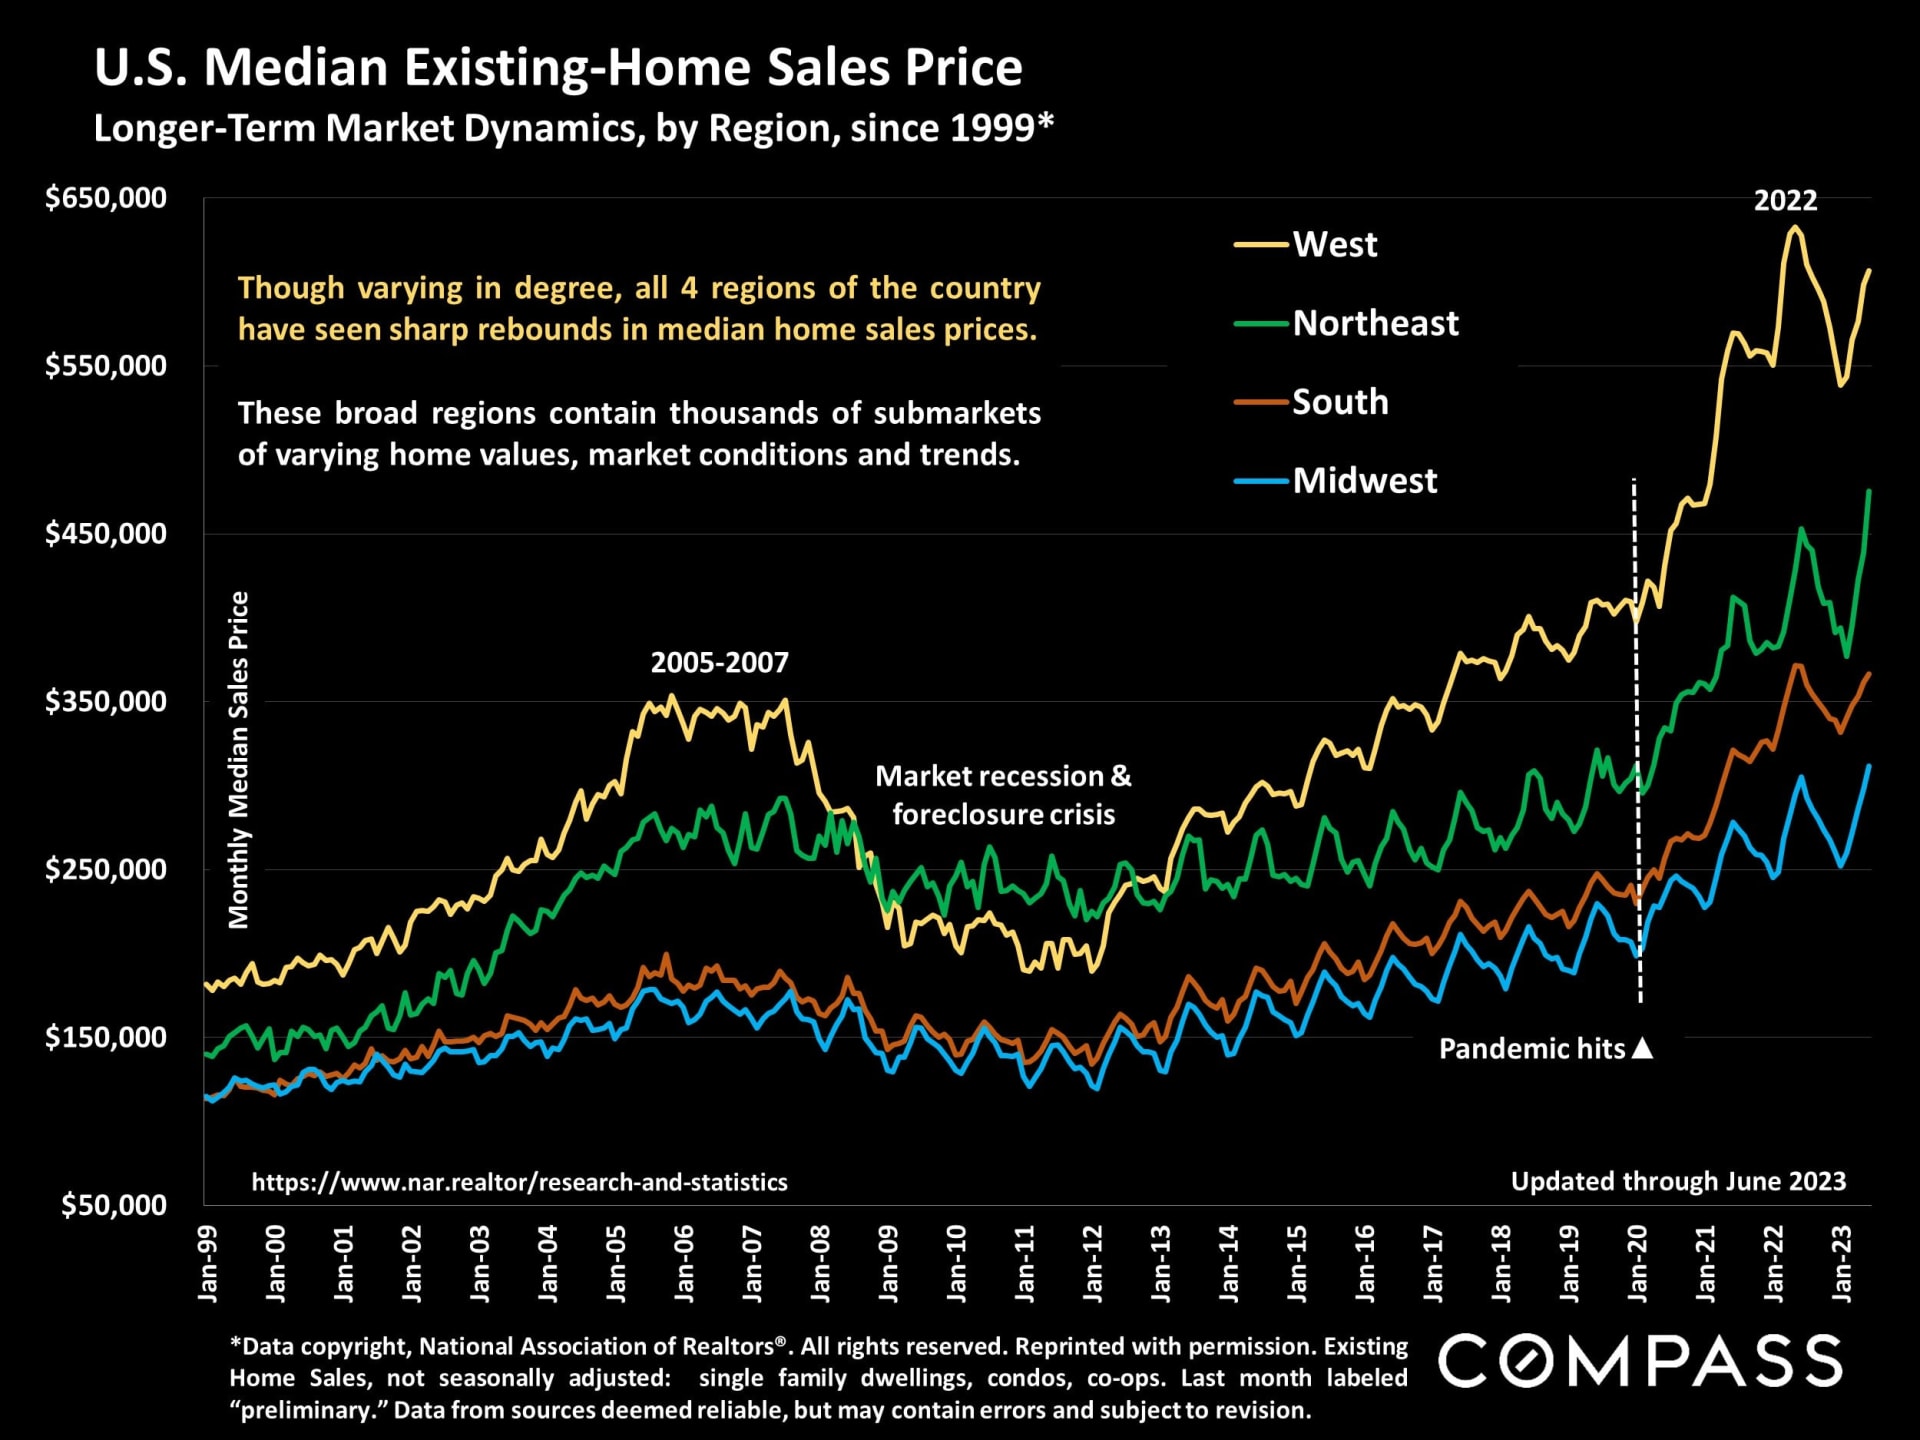
Regional home-price trends generally run roughly parallel over the longer-term, though varying in degree of change within periods due to local conditions.
|
|
|
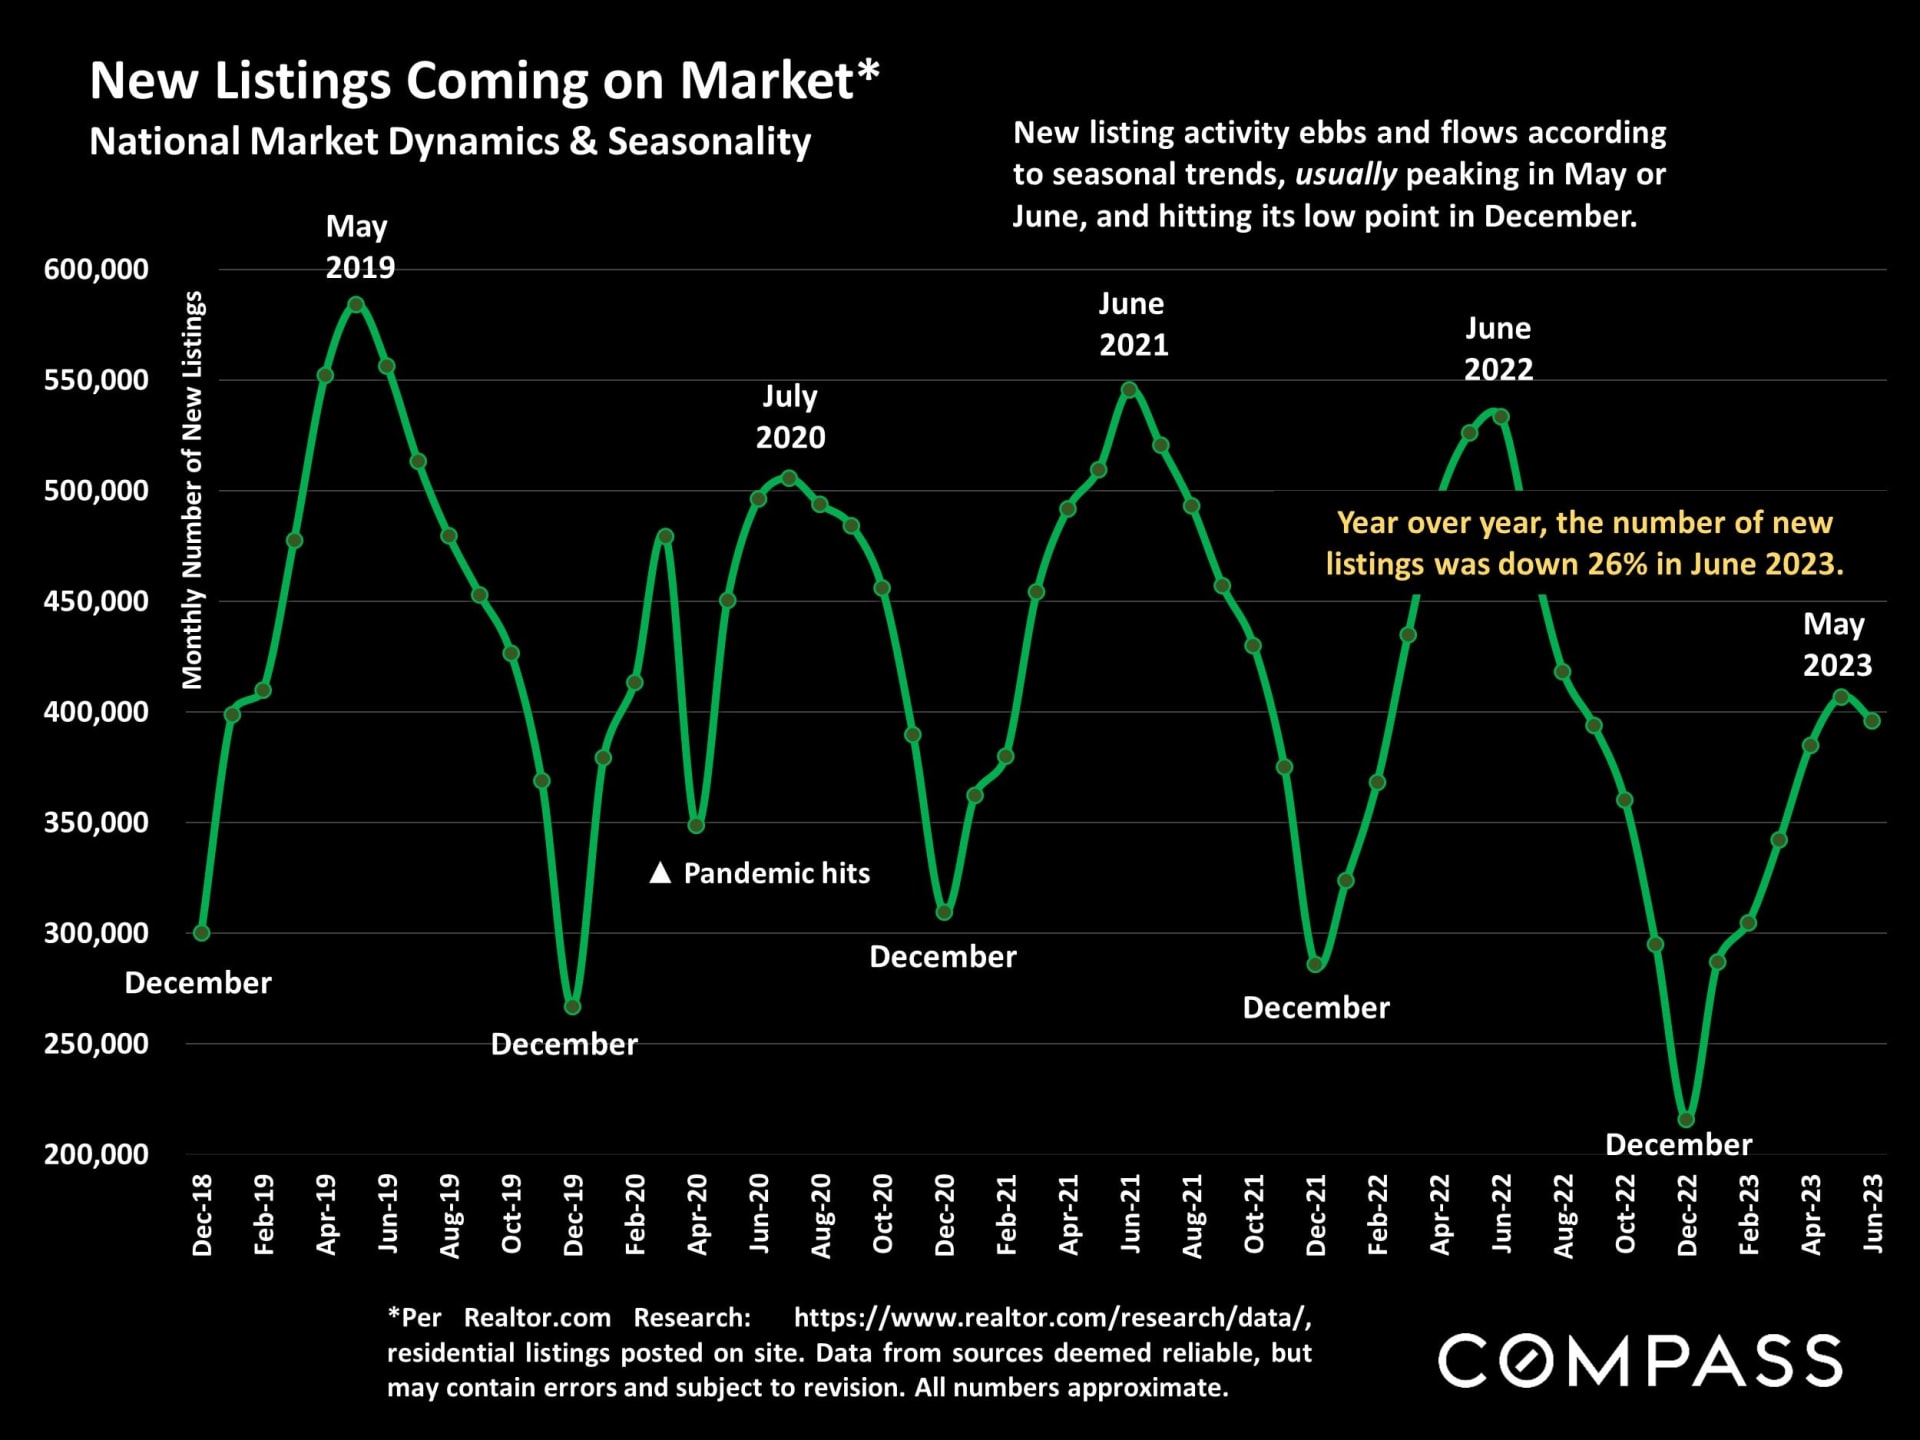
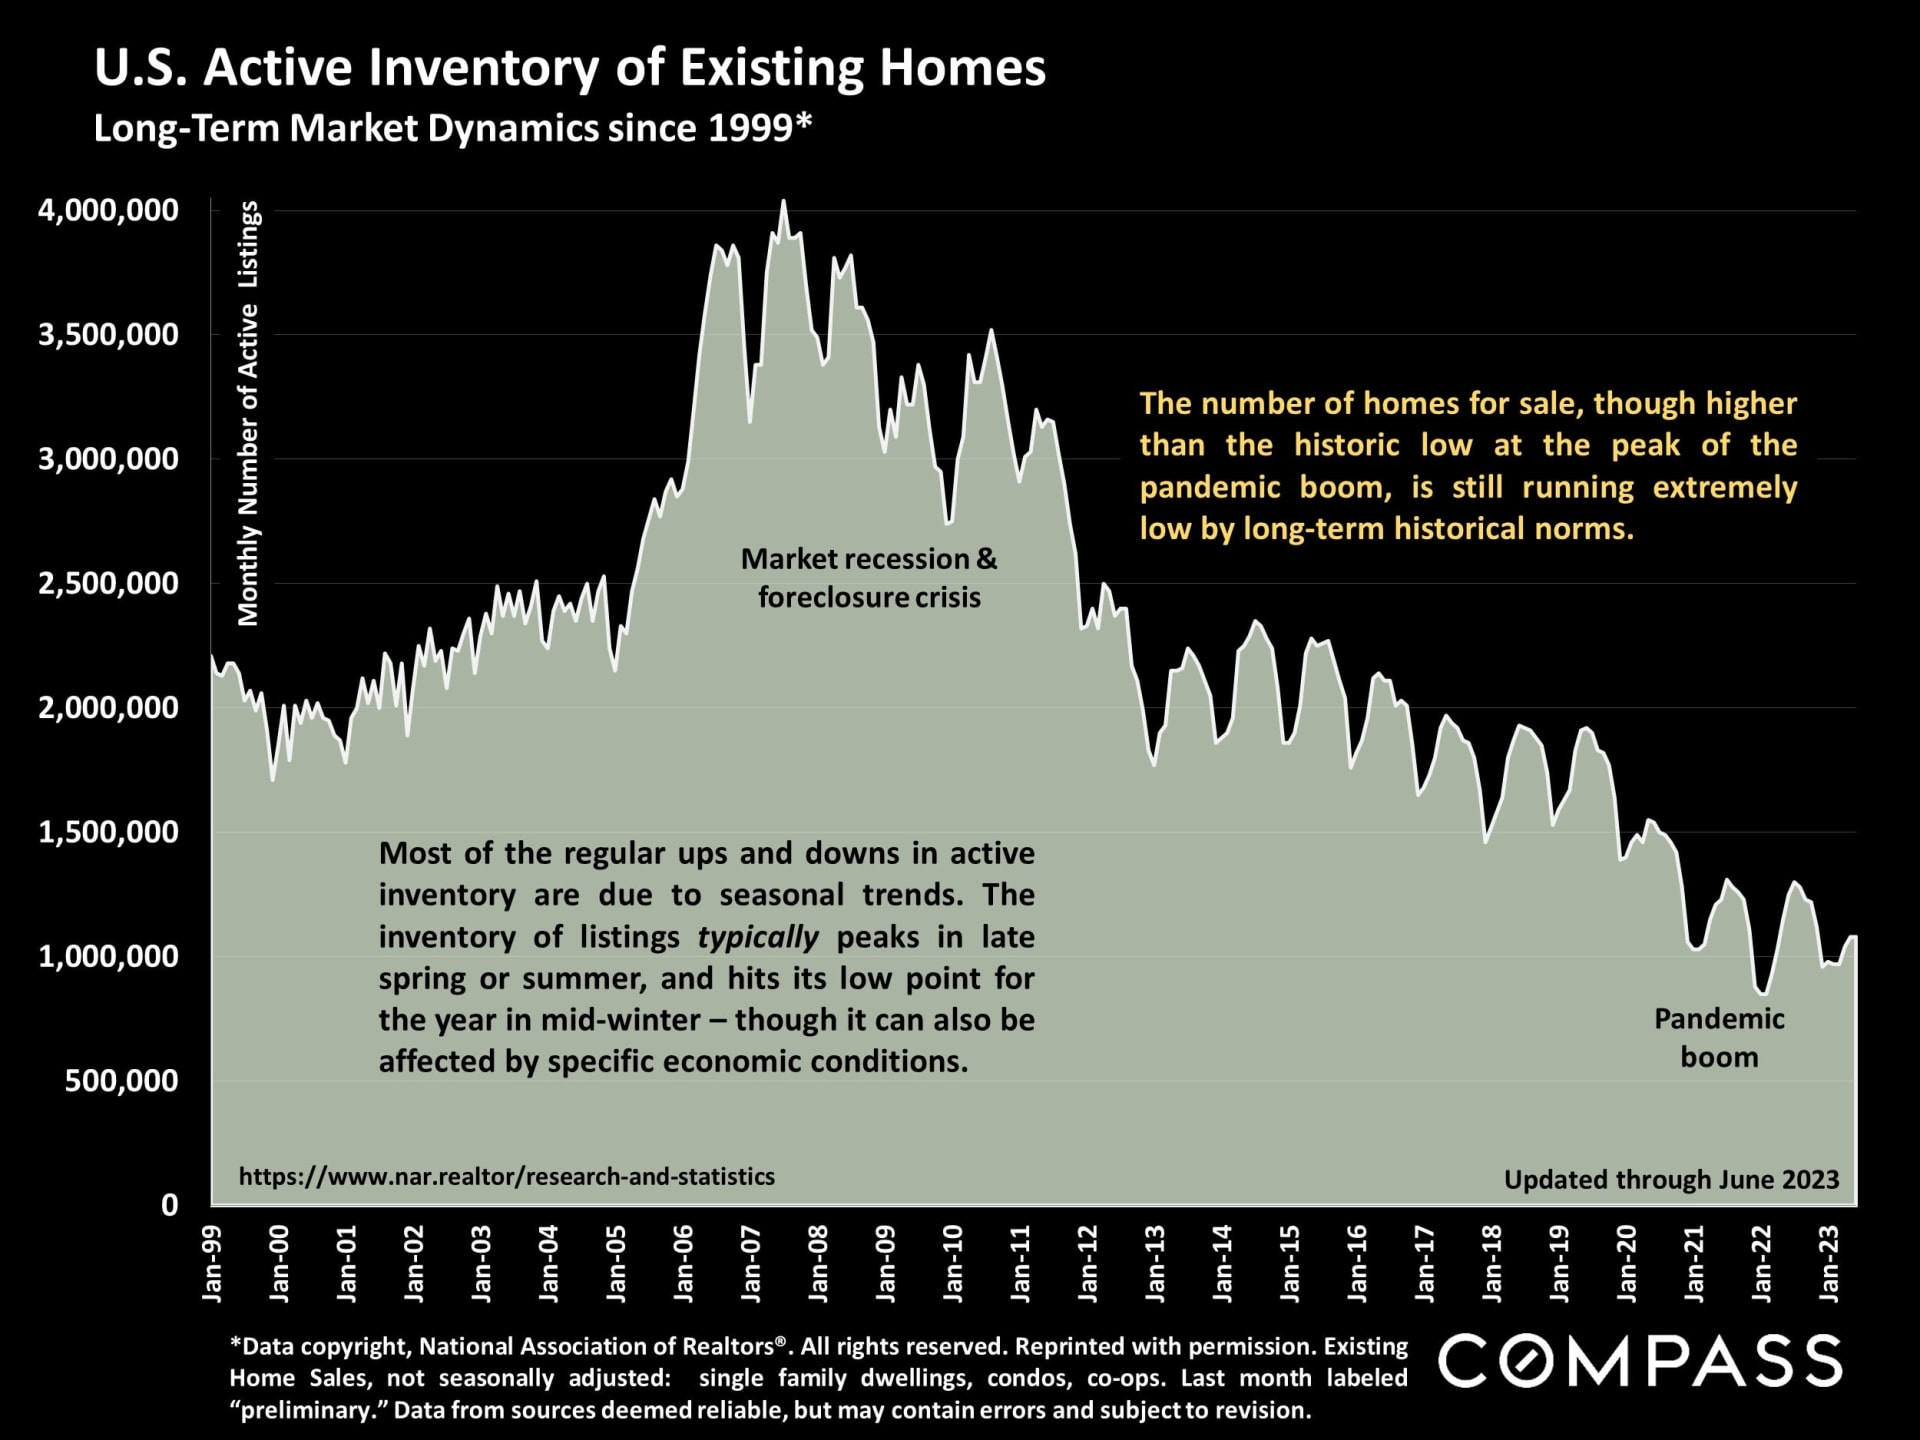
Over the past year, the severe, cumulative decline in the number of new listings has had major ramifications for market dynamics, and, in 2023, contributed to upward pressure on home prices.
|
|
|
The number of homes for sale remains very low, clearly inadequate to demand. Besides general economic factors, it ebbs and flows according to seasonal trends.
|
|
|
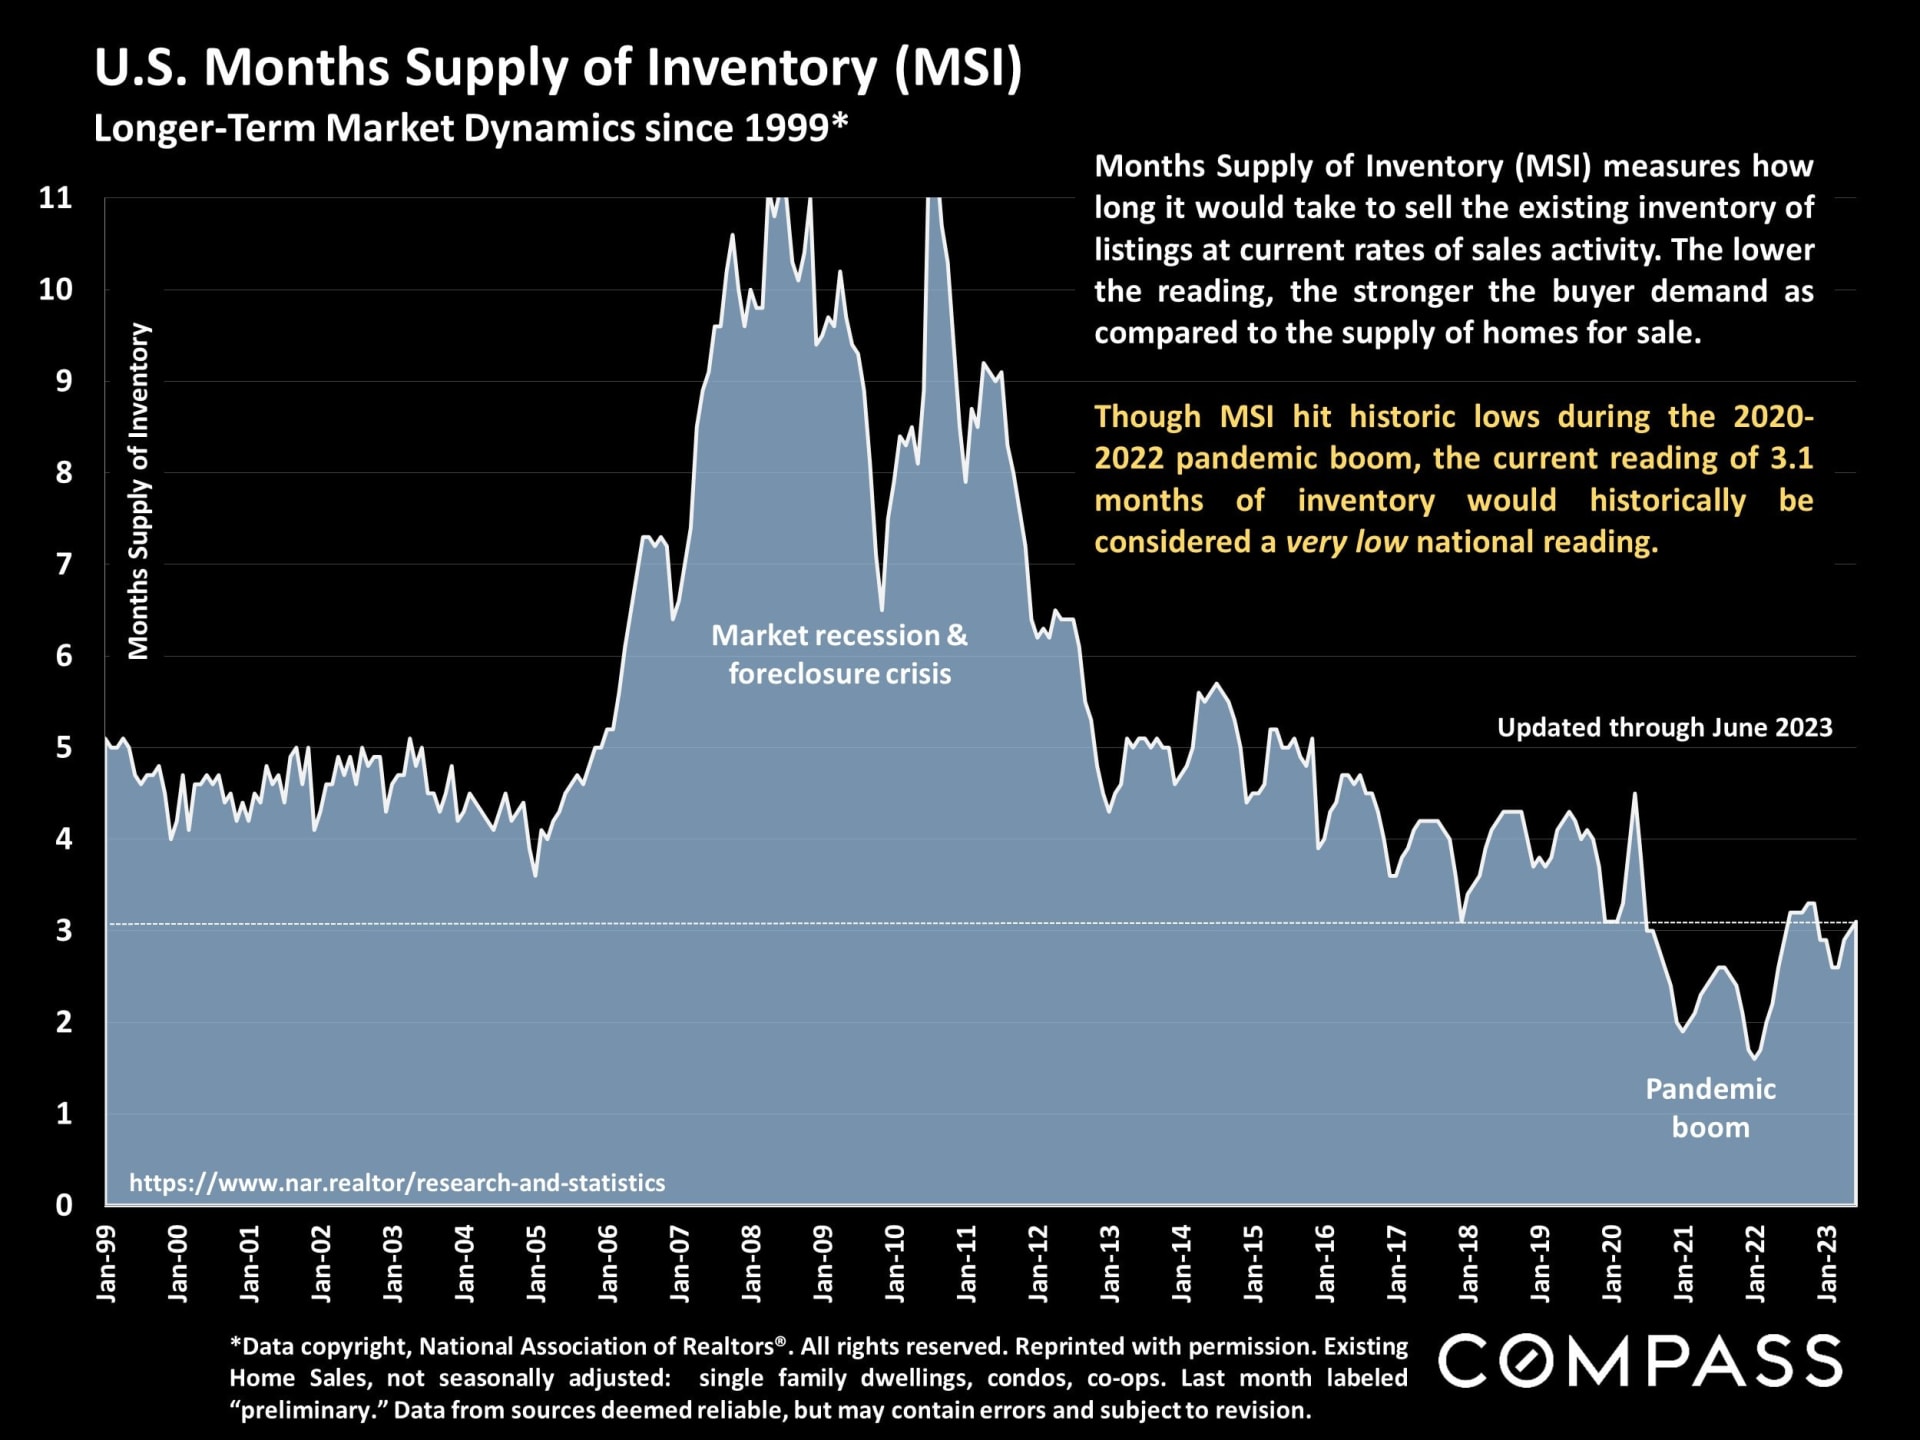
Months-supply-of-inventory compares the supply of listings to buyer demand: Lower readings commonly signify more competitive, more heated markets.
|
|
|
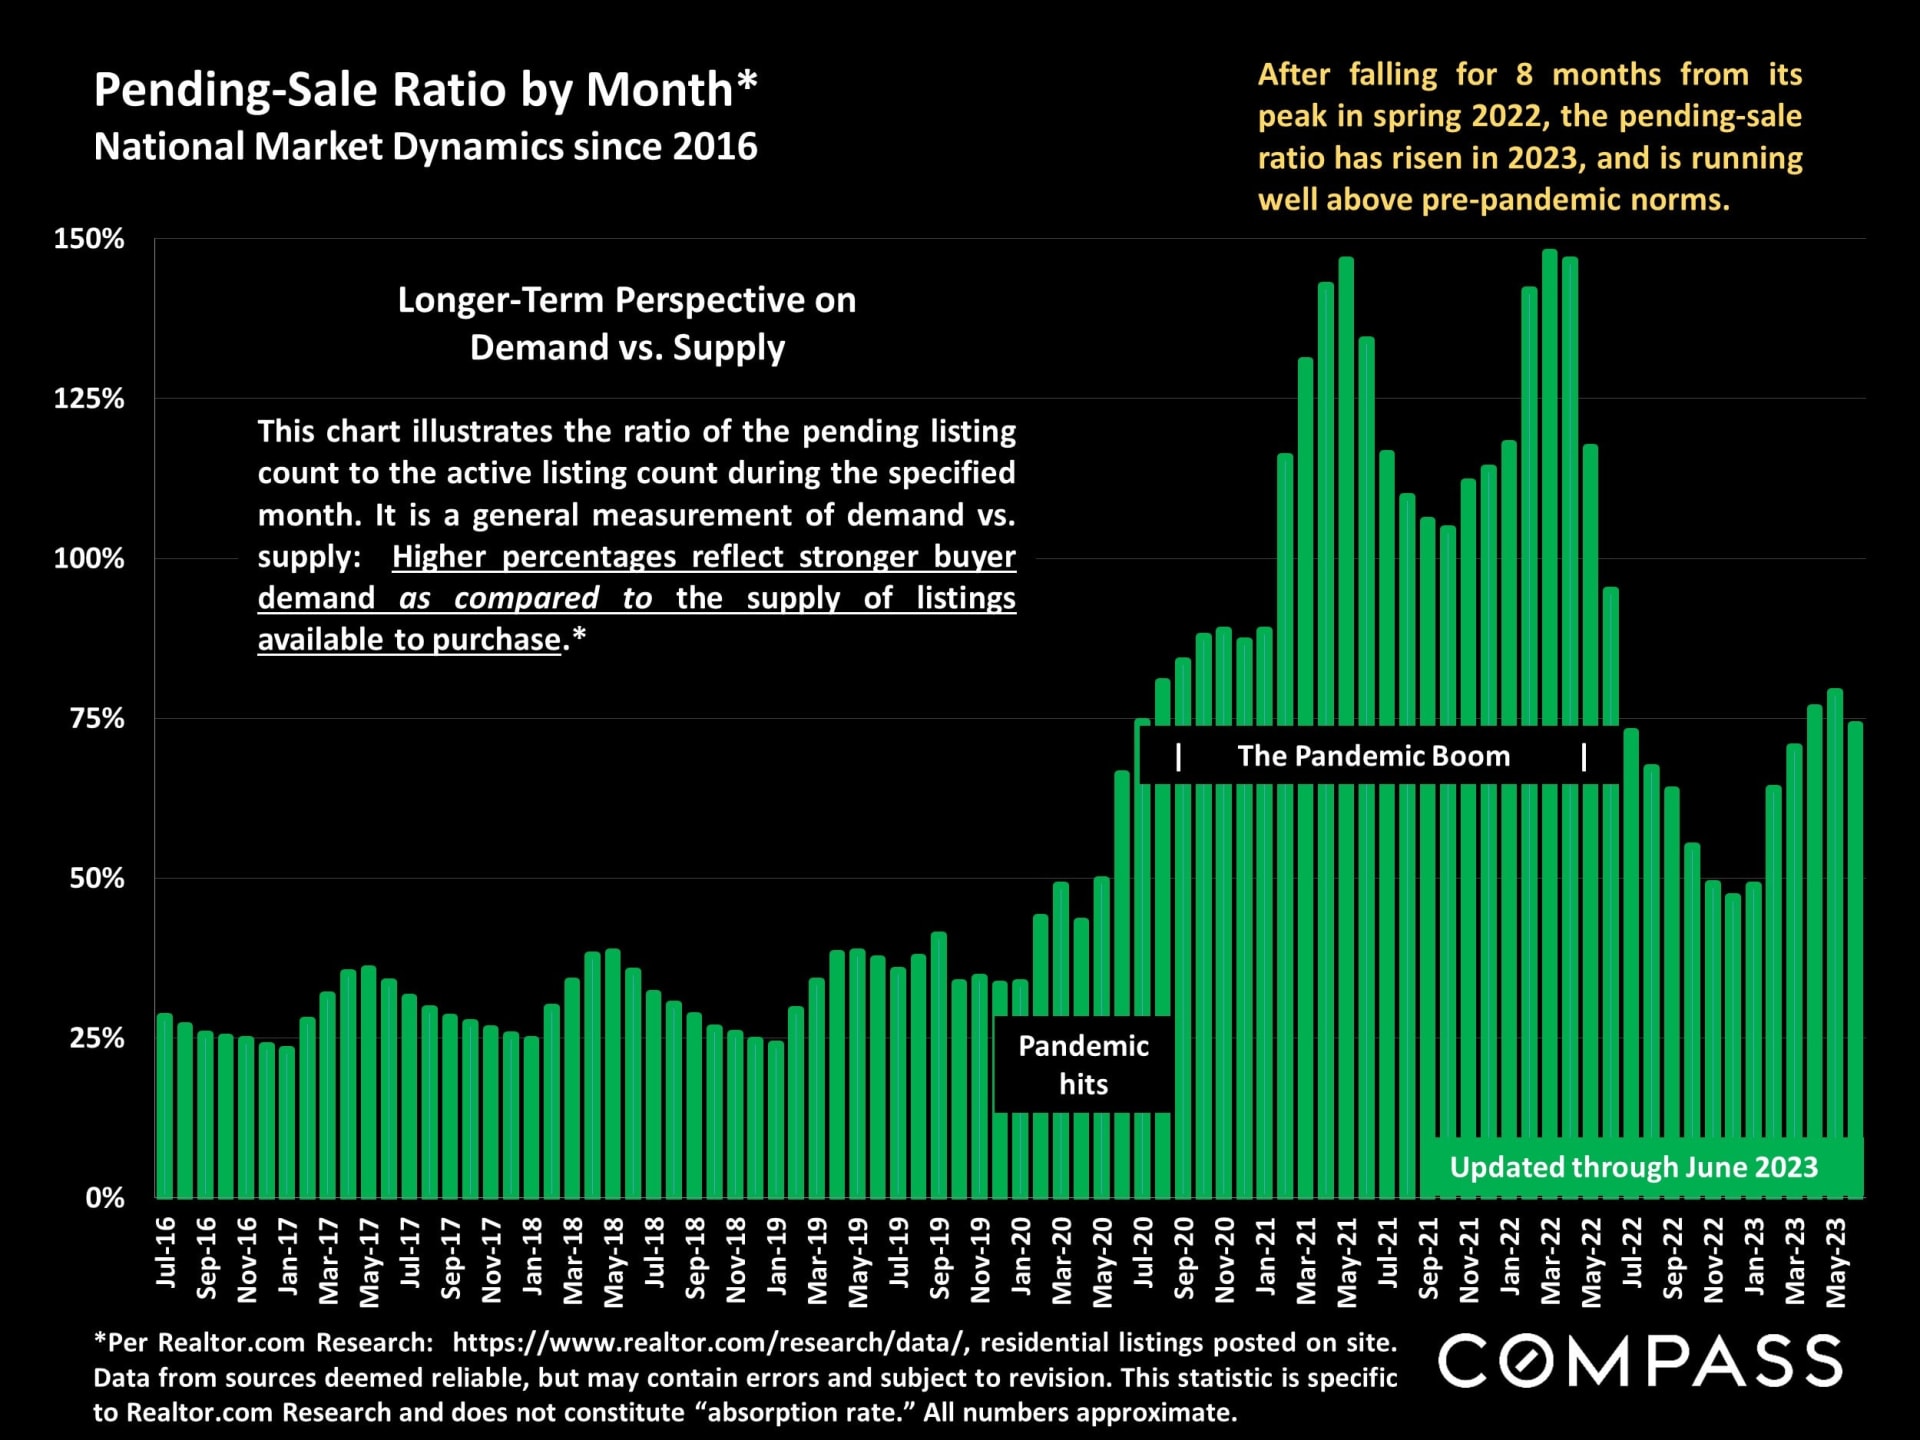
The ratio of pending listings (in contract) to active listings is another angle on supply and demand: Higher readings signify more competitive market conditions.
|
|
|
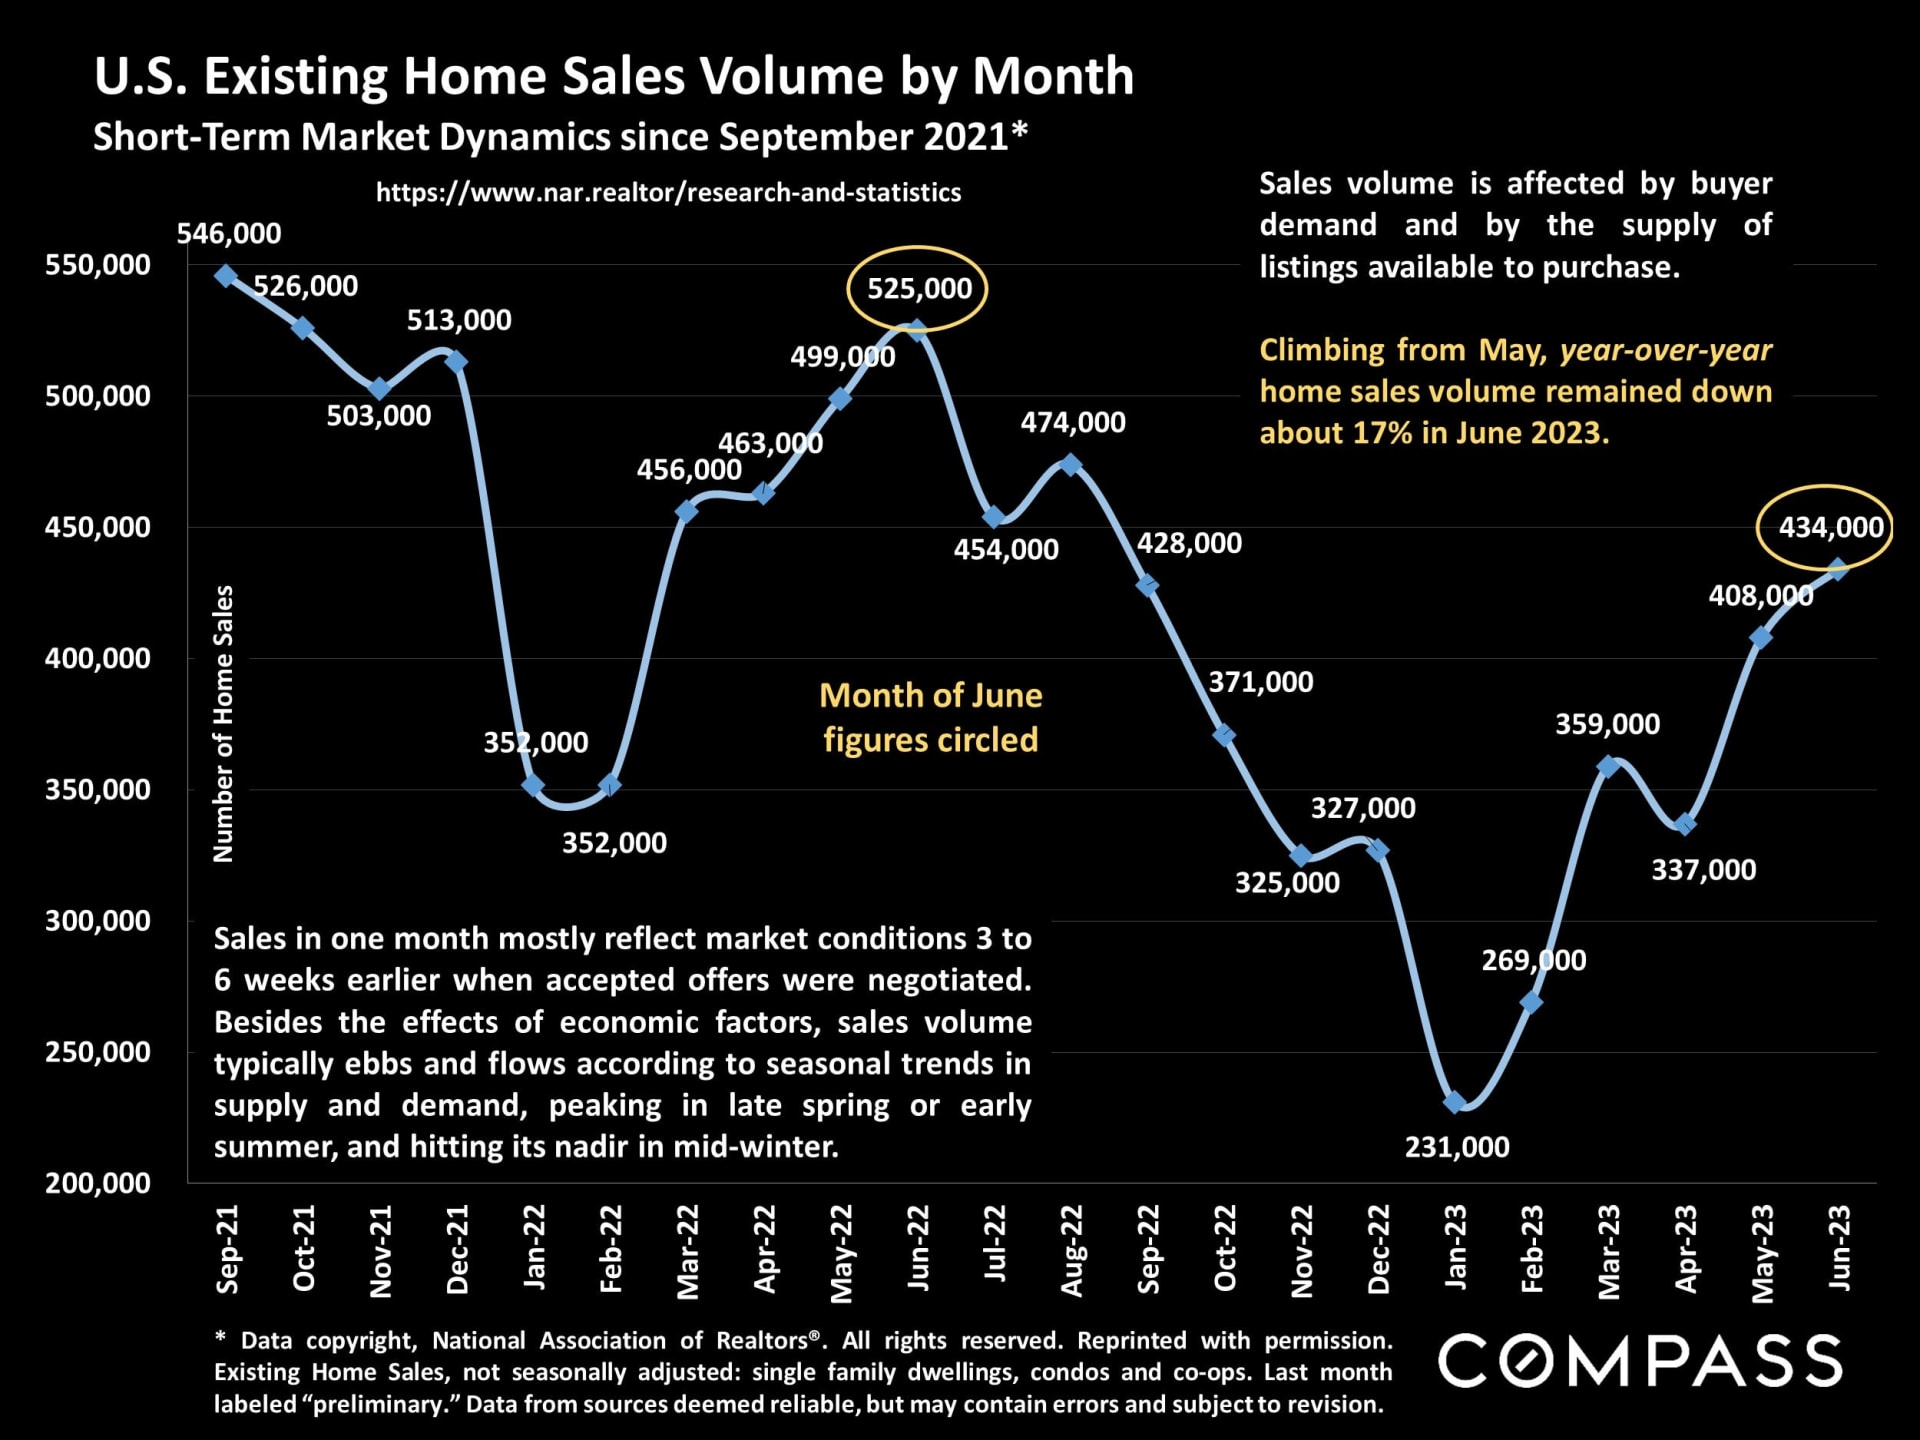
The number of home sales has rebounded from the nadir of late 2022, but remains depressed, lower than historical norms, largely due to the decline in new listings.
|
|
|
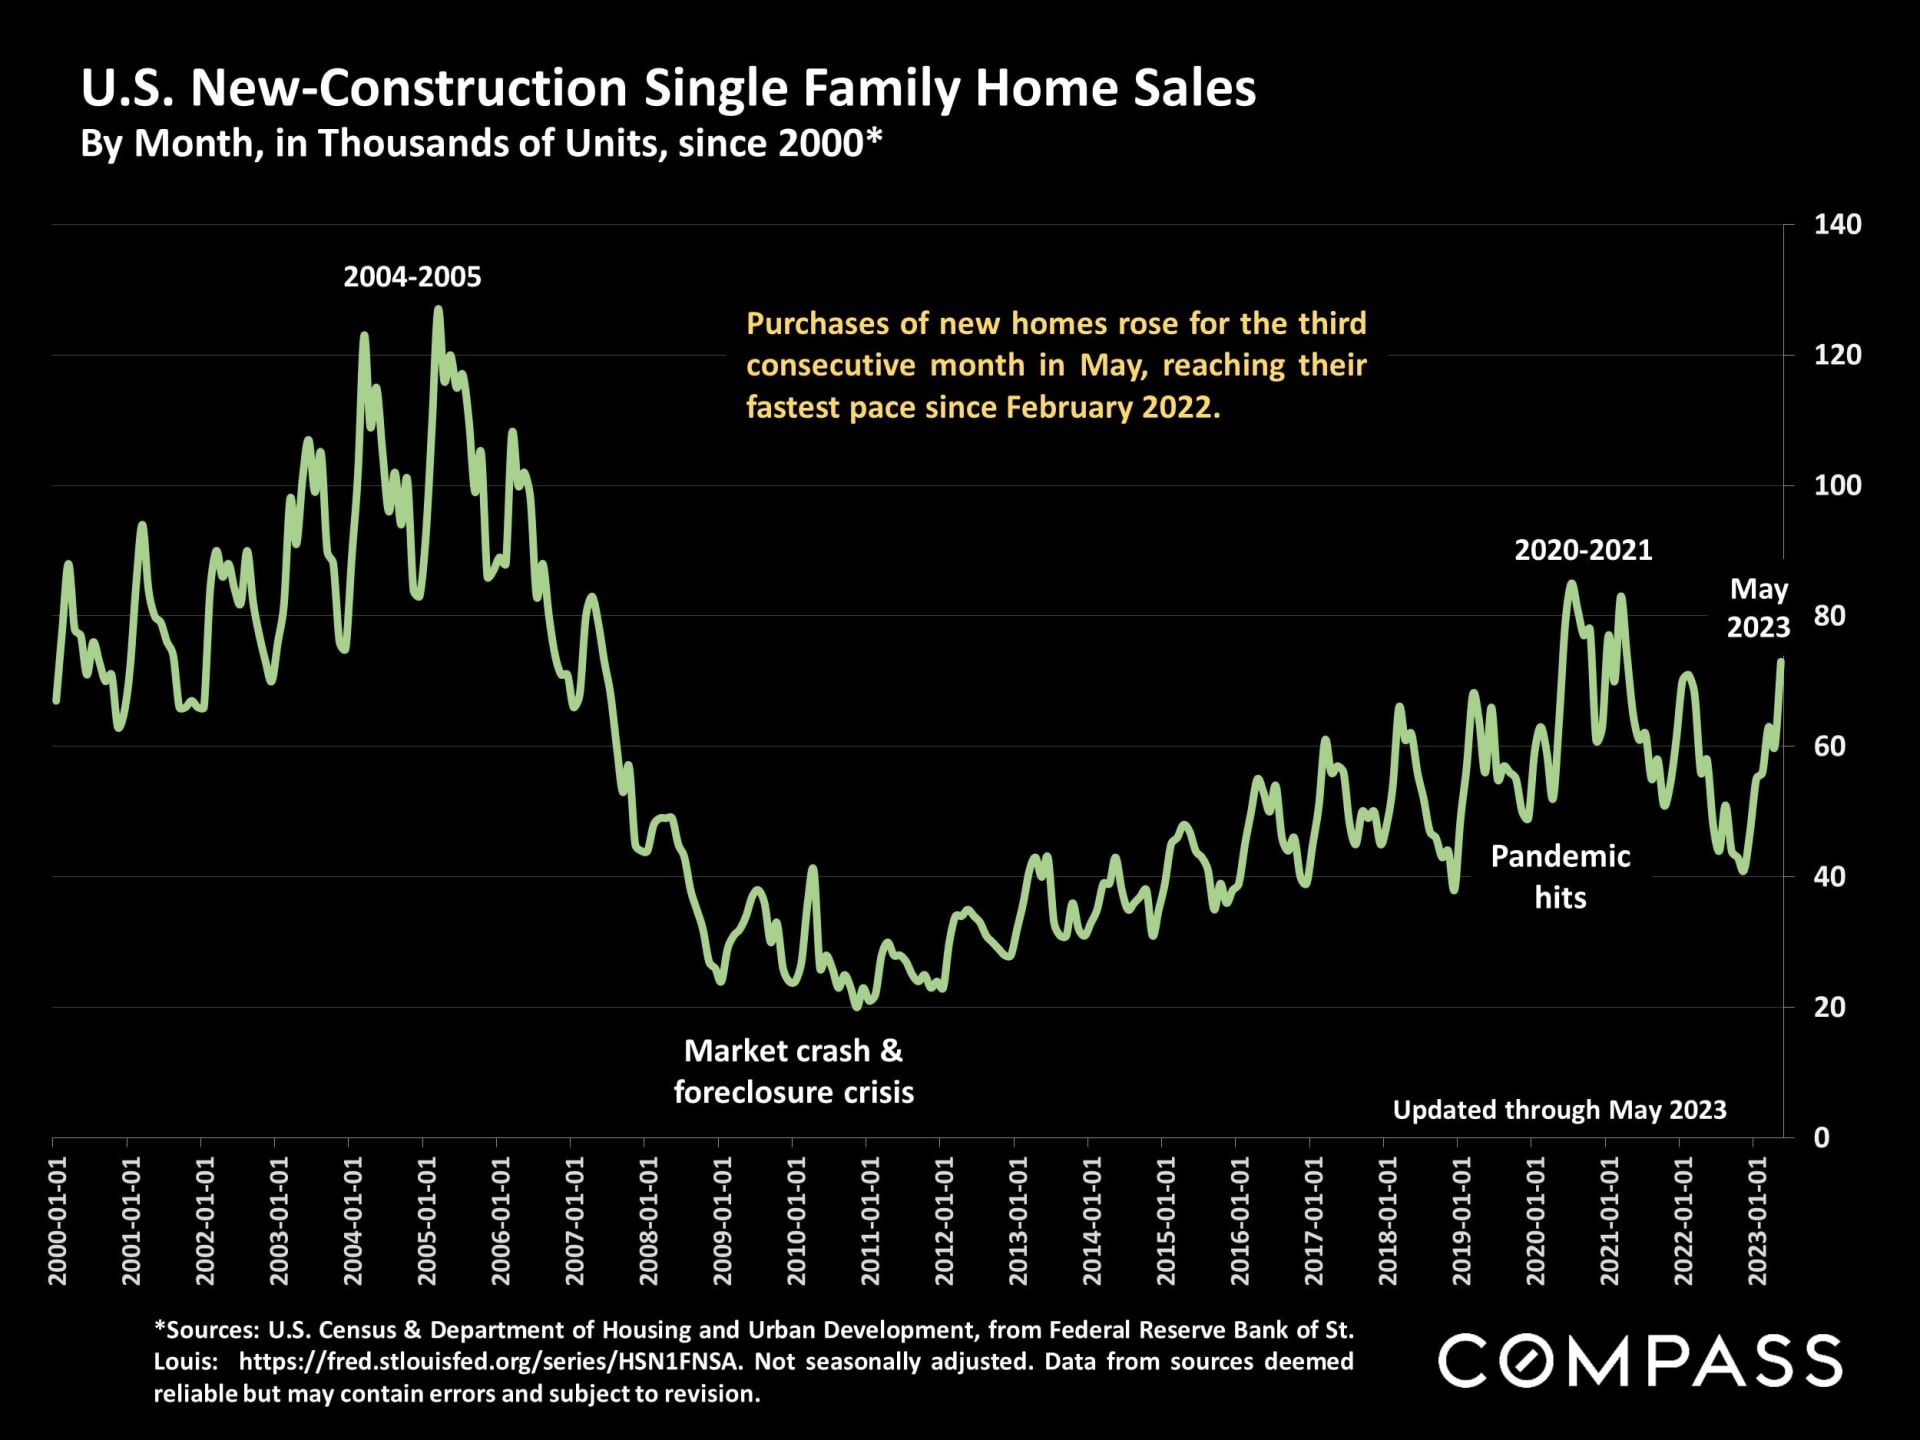
While many homeowners have held back from listing their homes in the past year, developers are quickly increasing the construction of new homes - and sales.
|
|
|
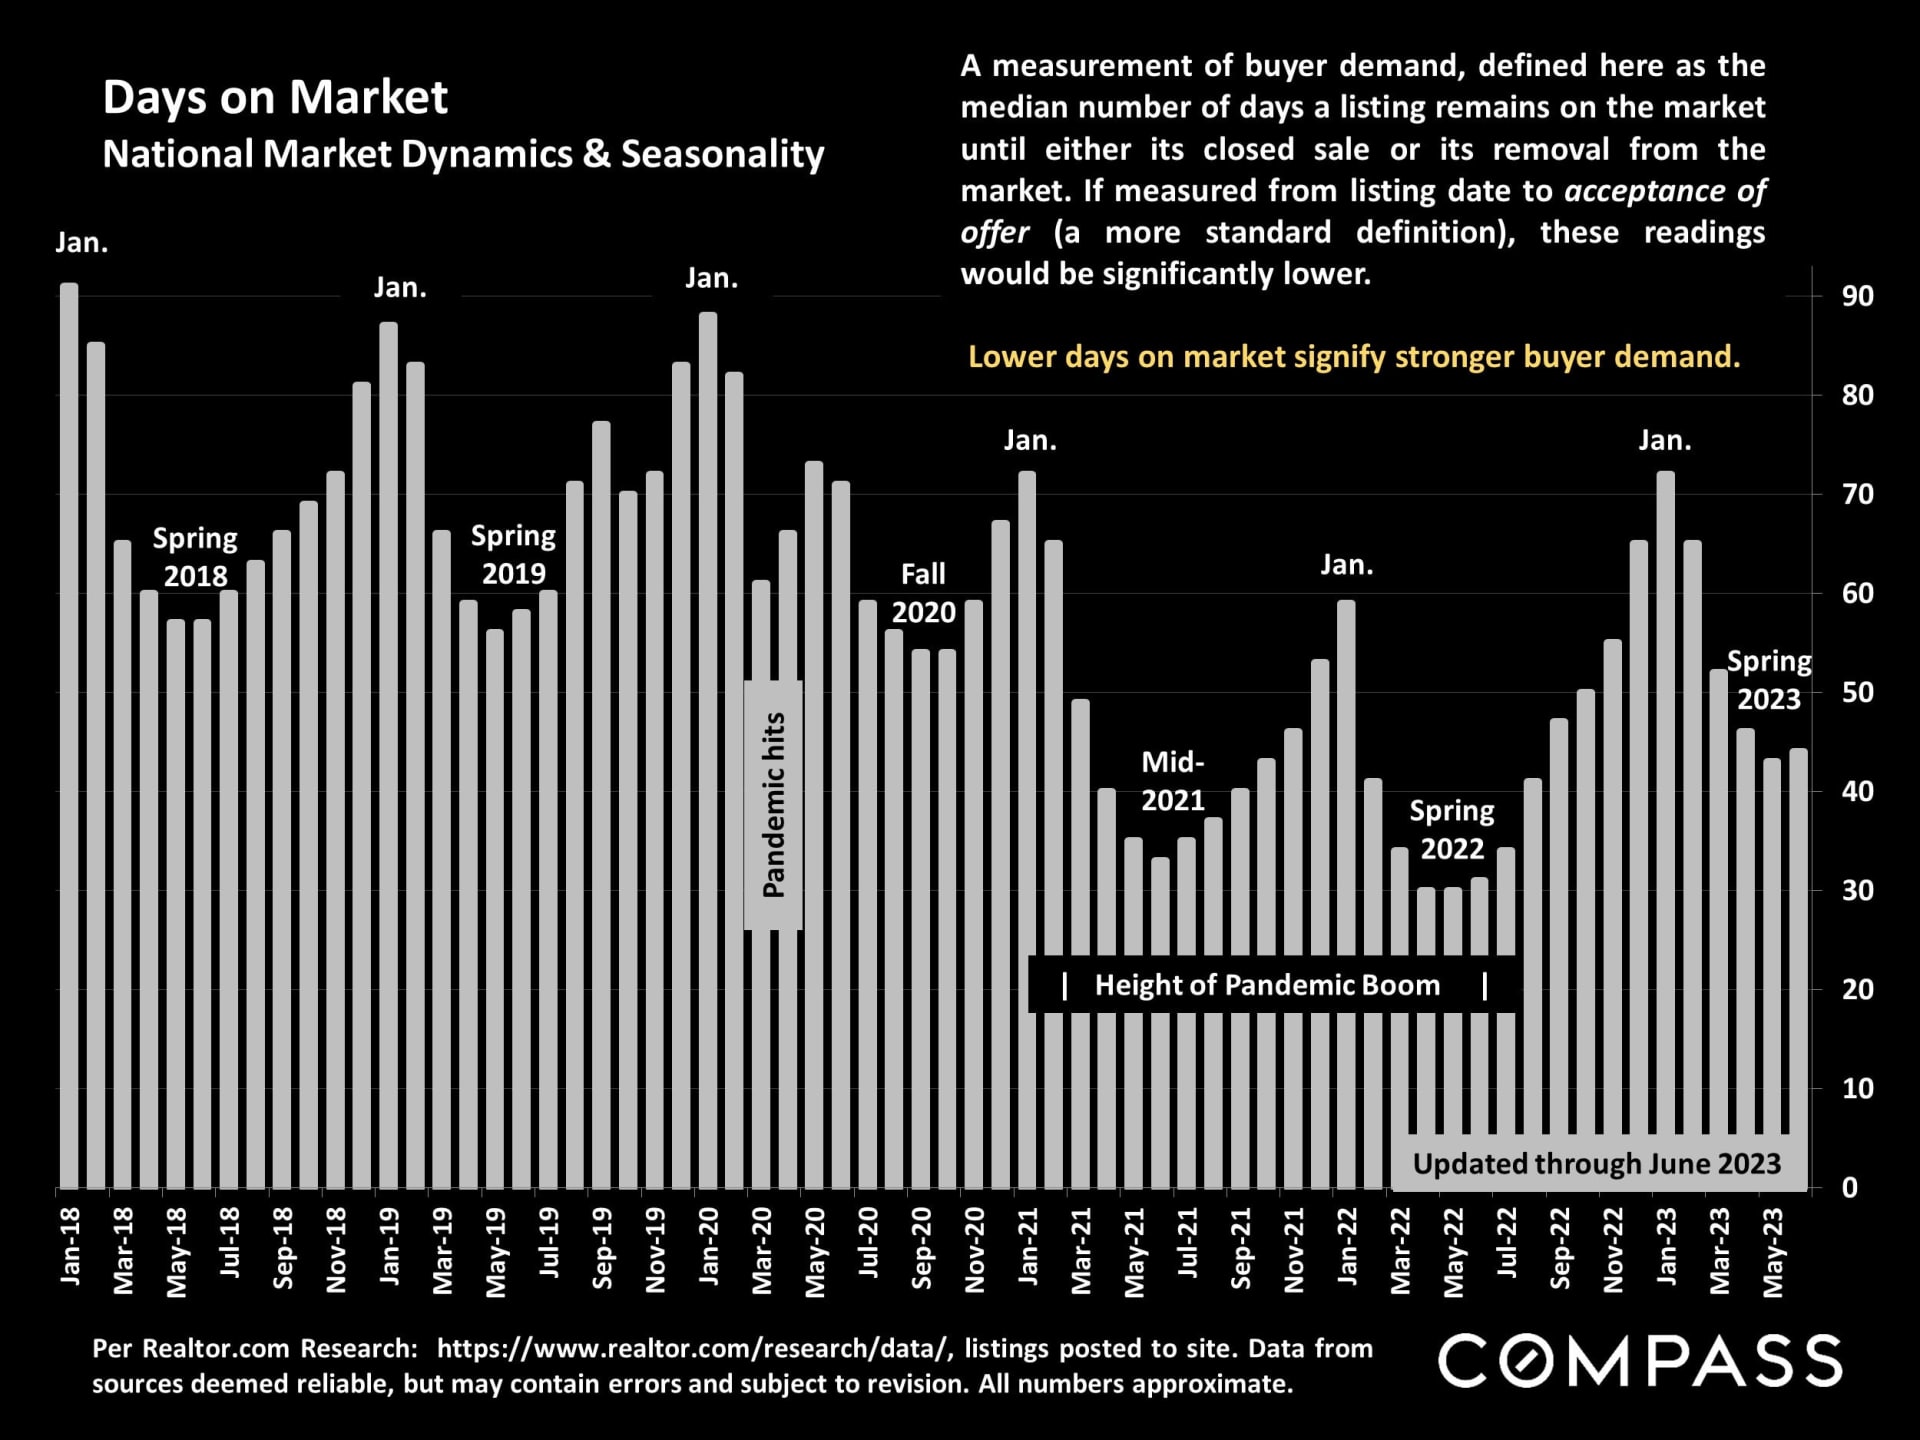
| Days on market are currently higher than during the pandemic boom, but lower than historical norms. As with most indicators, they fluctuate by season. |
|
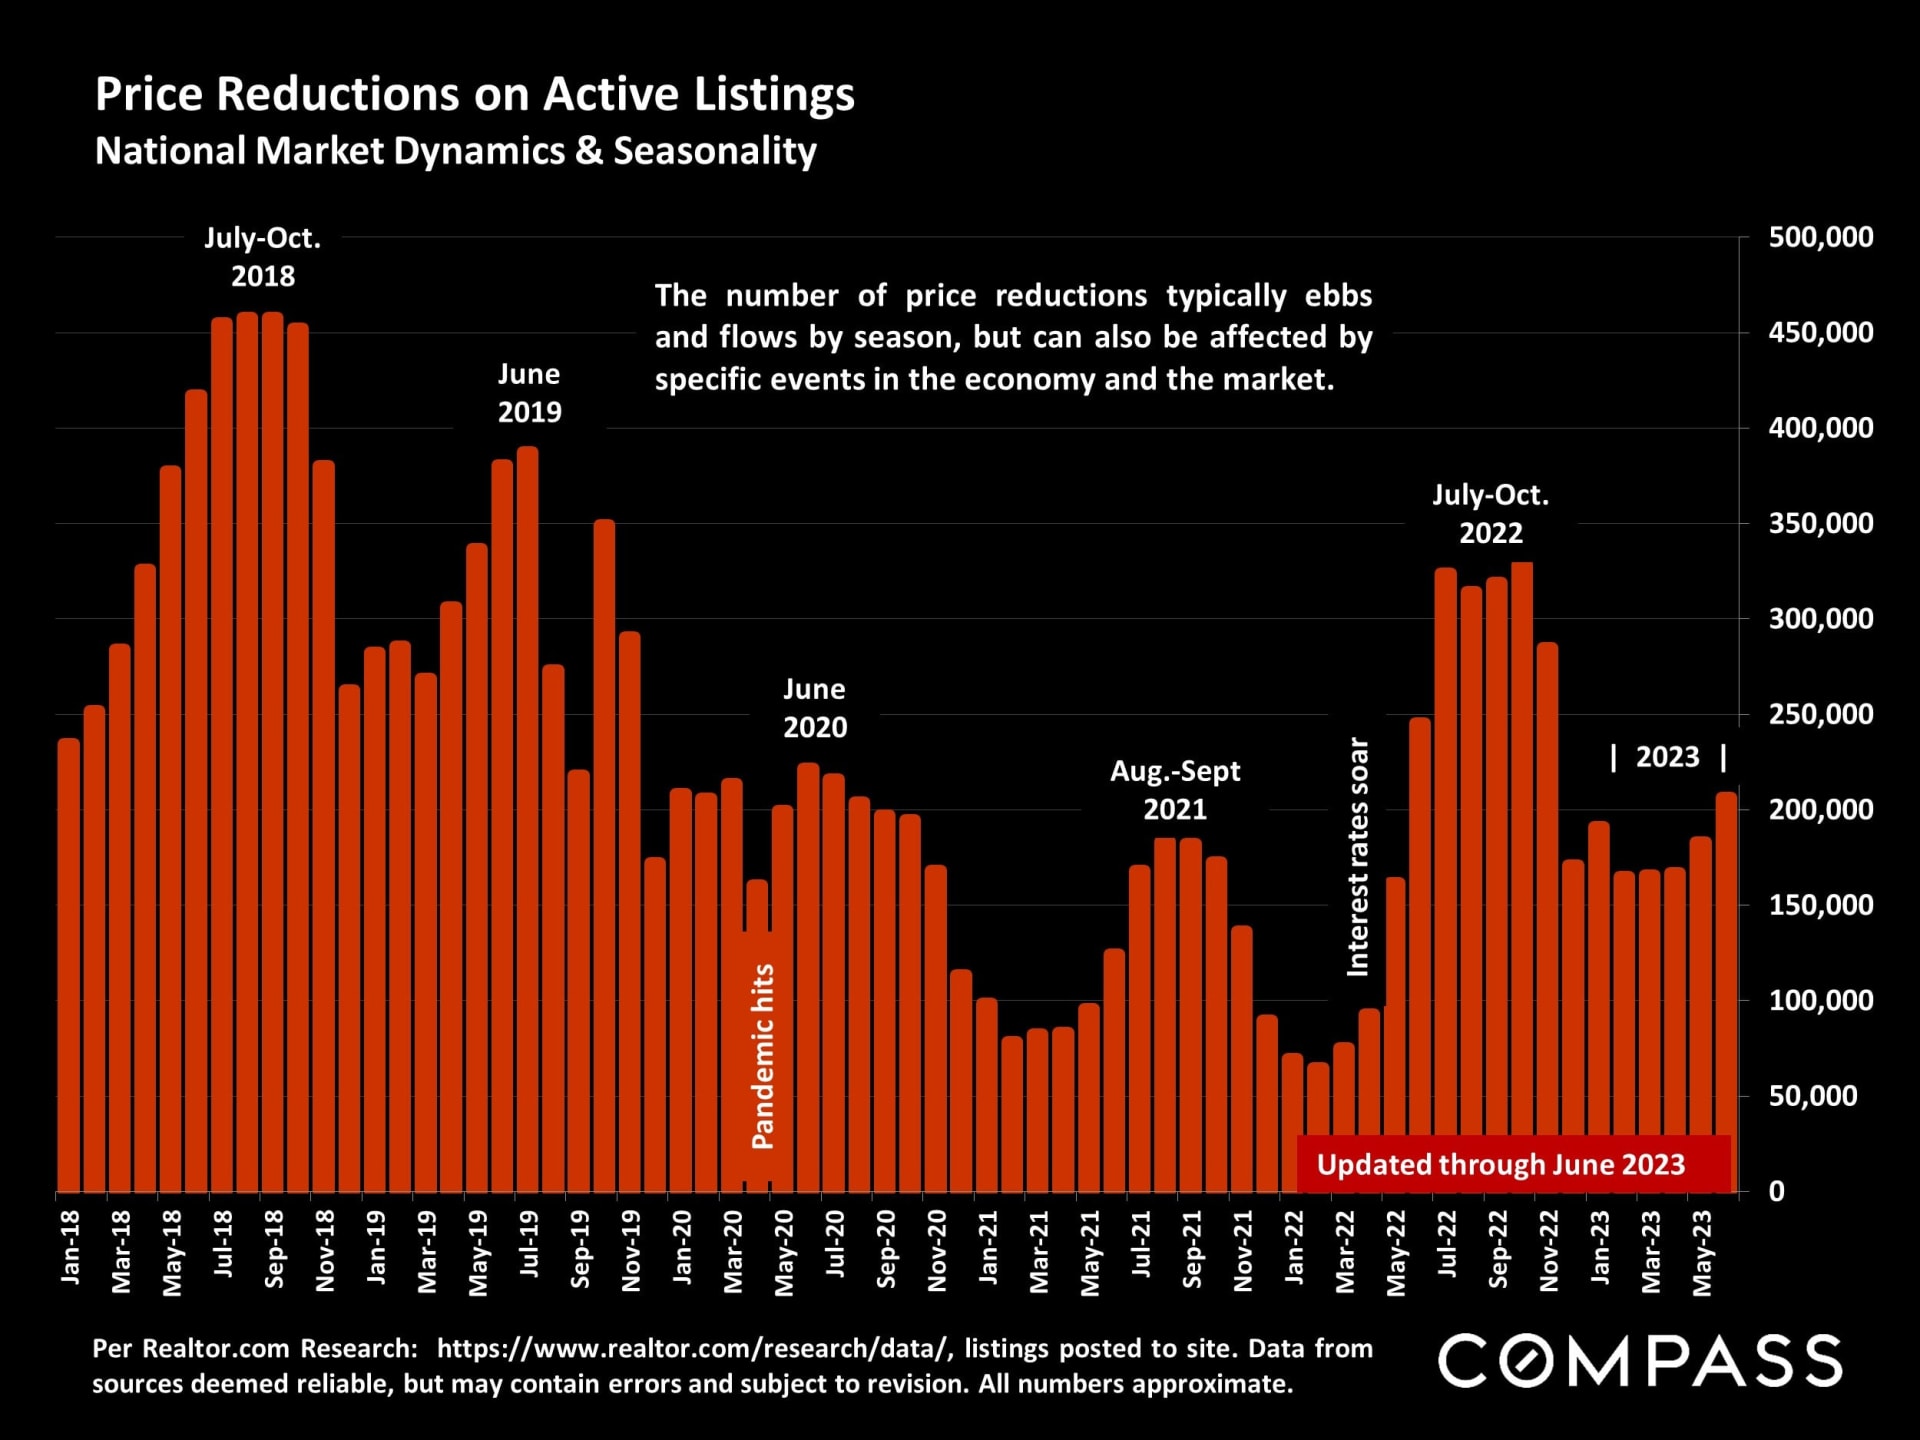
Price reductions rise and fall per sudden changes in economic conditions, and, more regularly, per seasonal trends in supply and demand.
|
|
|
A long-term illustration of interest rates: Over the past year, after the dramatic rise in early 2022, 30-year fixed rates have generally ranged between 6% and 7%.
|
|
|
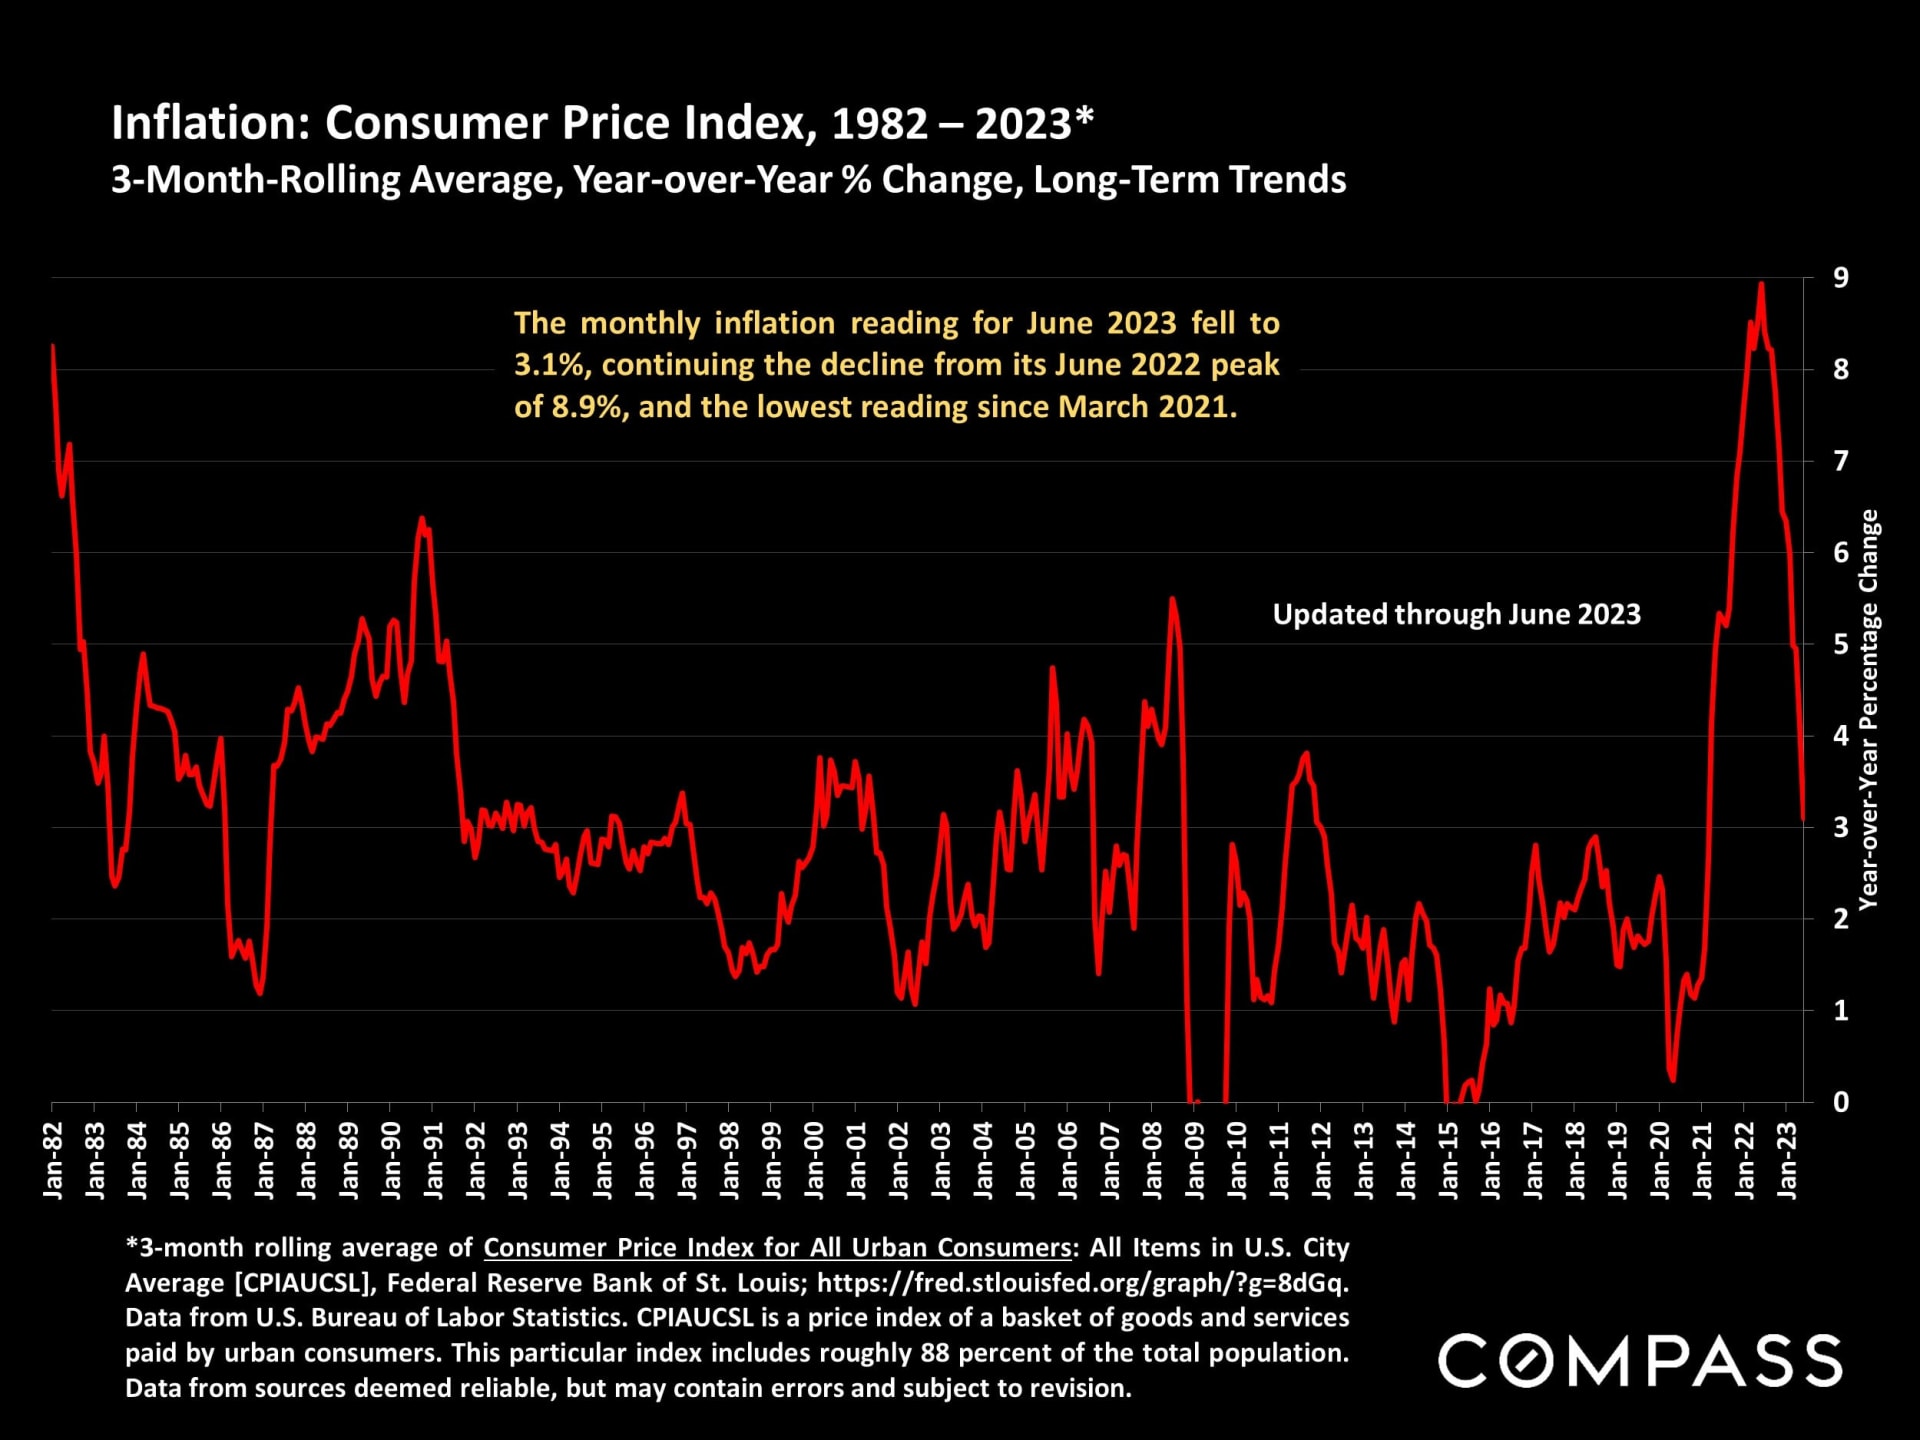
Inflation became a critical economic dynamic in the last 18 months, soaring to a 4-decade high in June 2022, then falling quickly since.
|
|
|
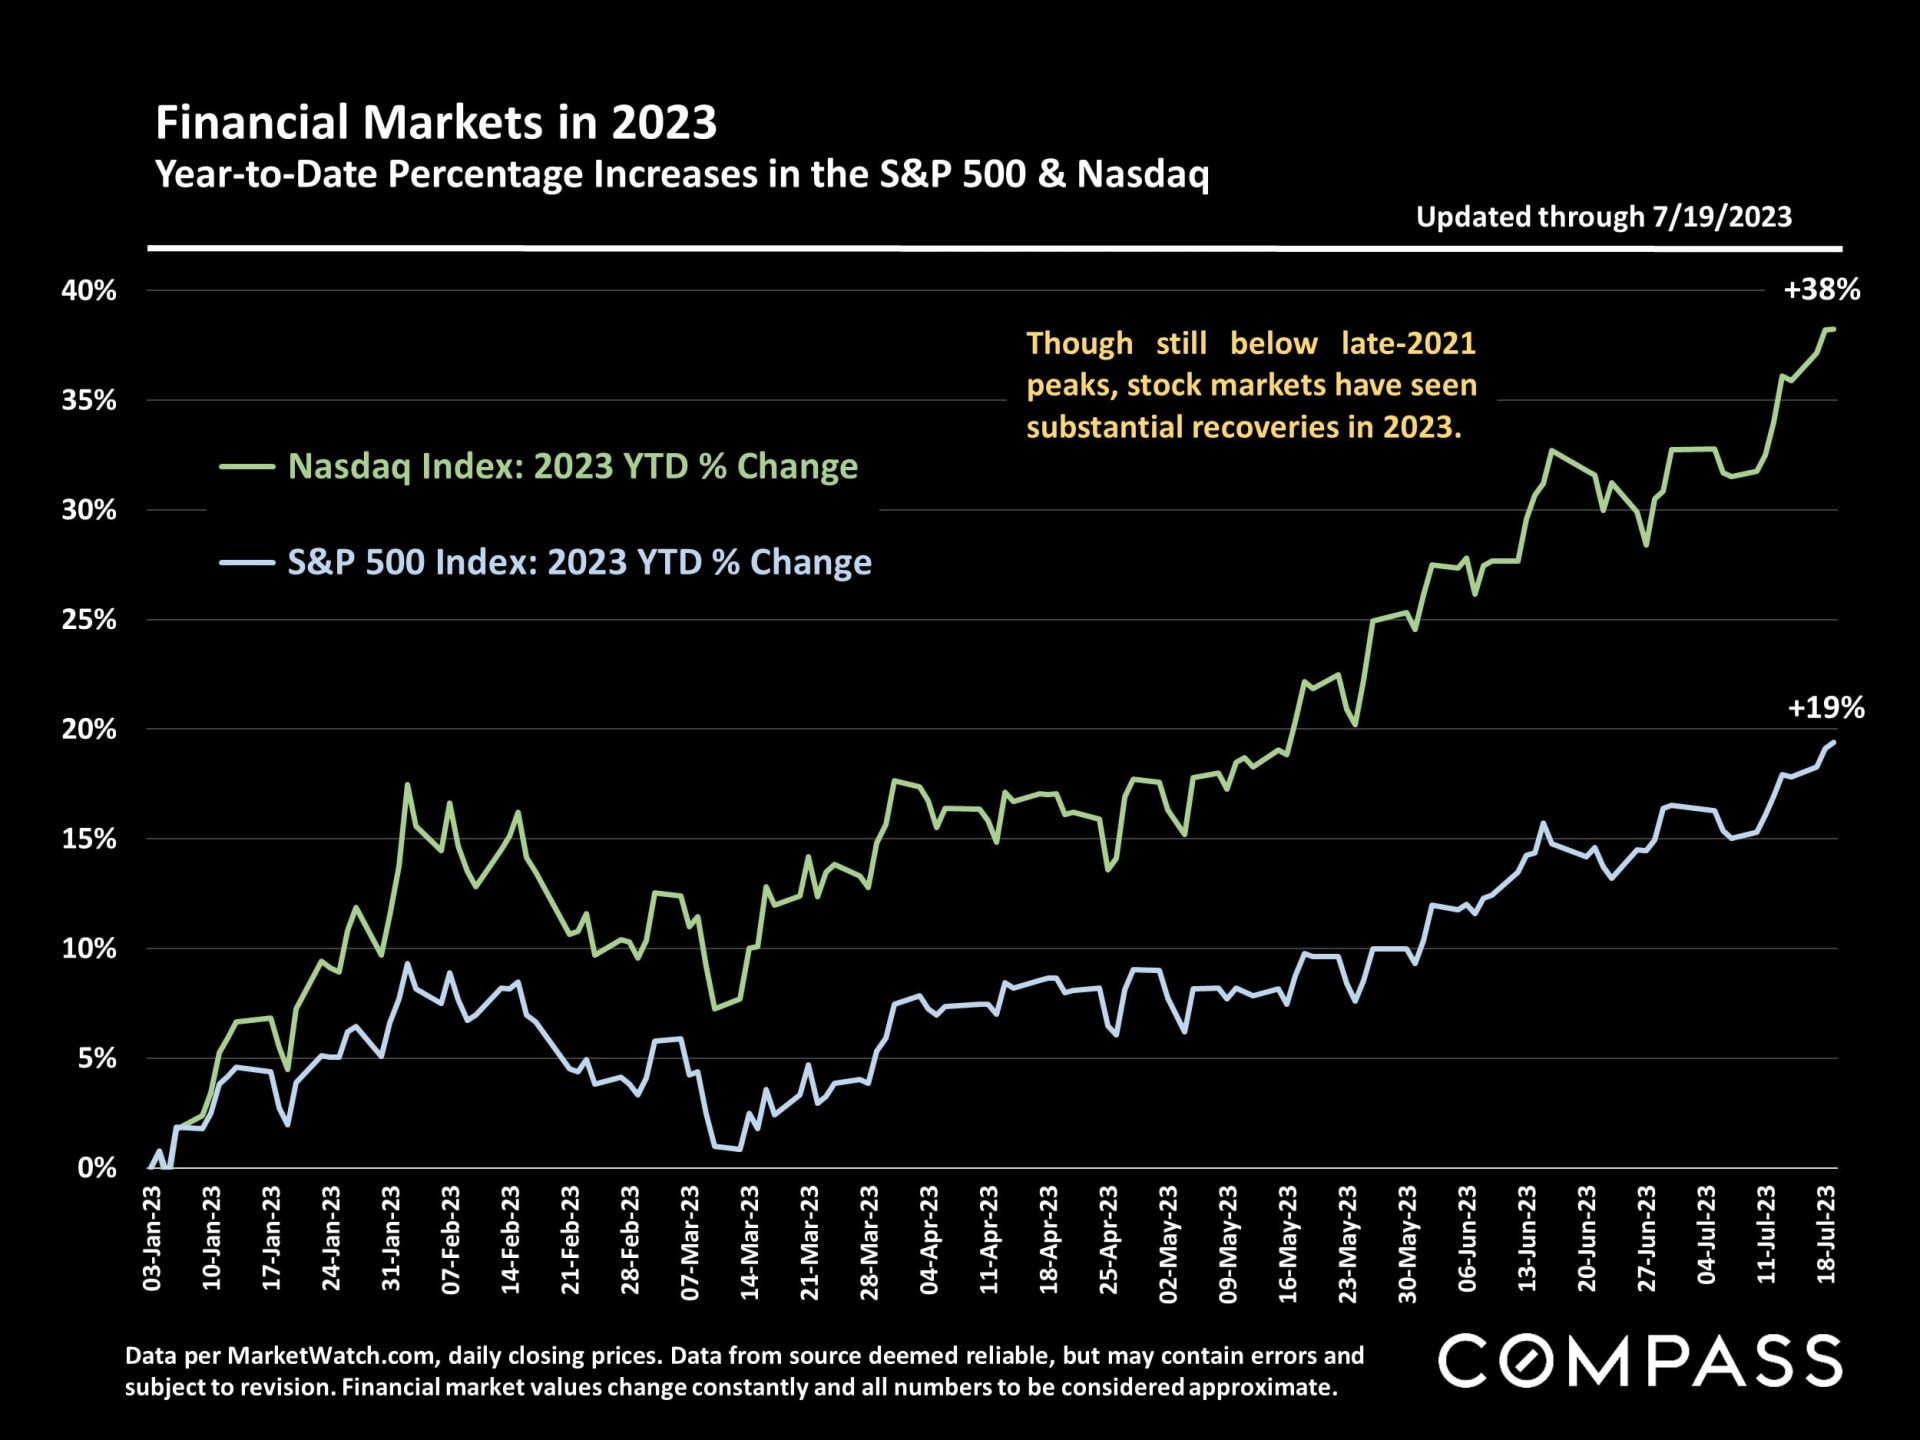
Financial markets have soared in 2023, deeply impacting household wealth - a huge factor in housing markets, especially in higher price segments.
|
|
|