
Report Highlights
- Year over year, the median existing-single-family home sales price was up 5%, and the median condo/co-op sales price up 5.7%. Due to seasonal supply and demand dynamics, median sales prices typically climb early in the year to peak in late spring.
- Year over year, total existing-home sales were up 1.3% in January, but the number of homes selling for $1,000,000+ jumped 27%. Affluent buyers appear to be jumping back into the market more quickly, perhaps due to spectacular rebounds in stock markets.
- The number of new listings coming on market was up 25% from December, and should continue to climb rapidly through spring, but inventory remains far below long-term norms.
- The percentage of all-cash purchases hit its highest monthly point in almost 10 years, and the average number of offers received was the highest since last summer.
- As of February 22nd, interest rates have ticked up, but remain well below those seen in October 2023. Consumer confidence remained positive after the large jumps in December and January. The January inflation reading declined slightly, but not as much as analysts expected.
- Note that January statistics based on closed sales - sales prices, sales volume, days-on-market, overbidding, and so on - will mostly reflect listings that went into contract in late 2023, generally speaking the slowest market of the year. Spring, typically the most active and most competitive selling season, should soon result in substantial changes in all these indicators.
Note that January statistics based on closed sales - sales prices, sales volume, days-on-market, overbidding, and so on - will mostly reflect listings that went into contract in late 2023, generally speaking the slowest market of the year. Spring, typically the most active and most competitive selling season, should soon result in substantial changes in all these indicators.
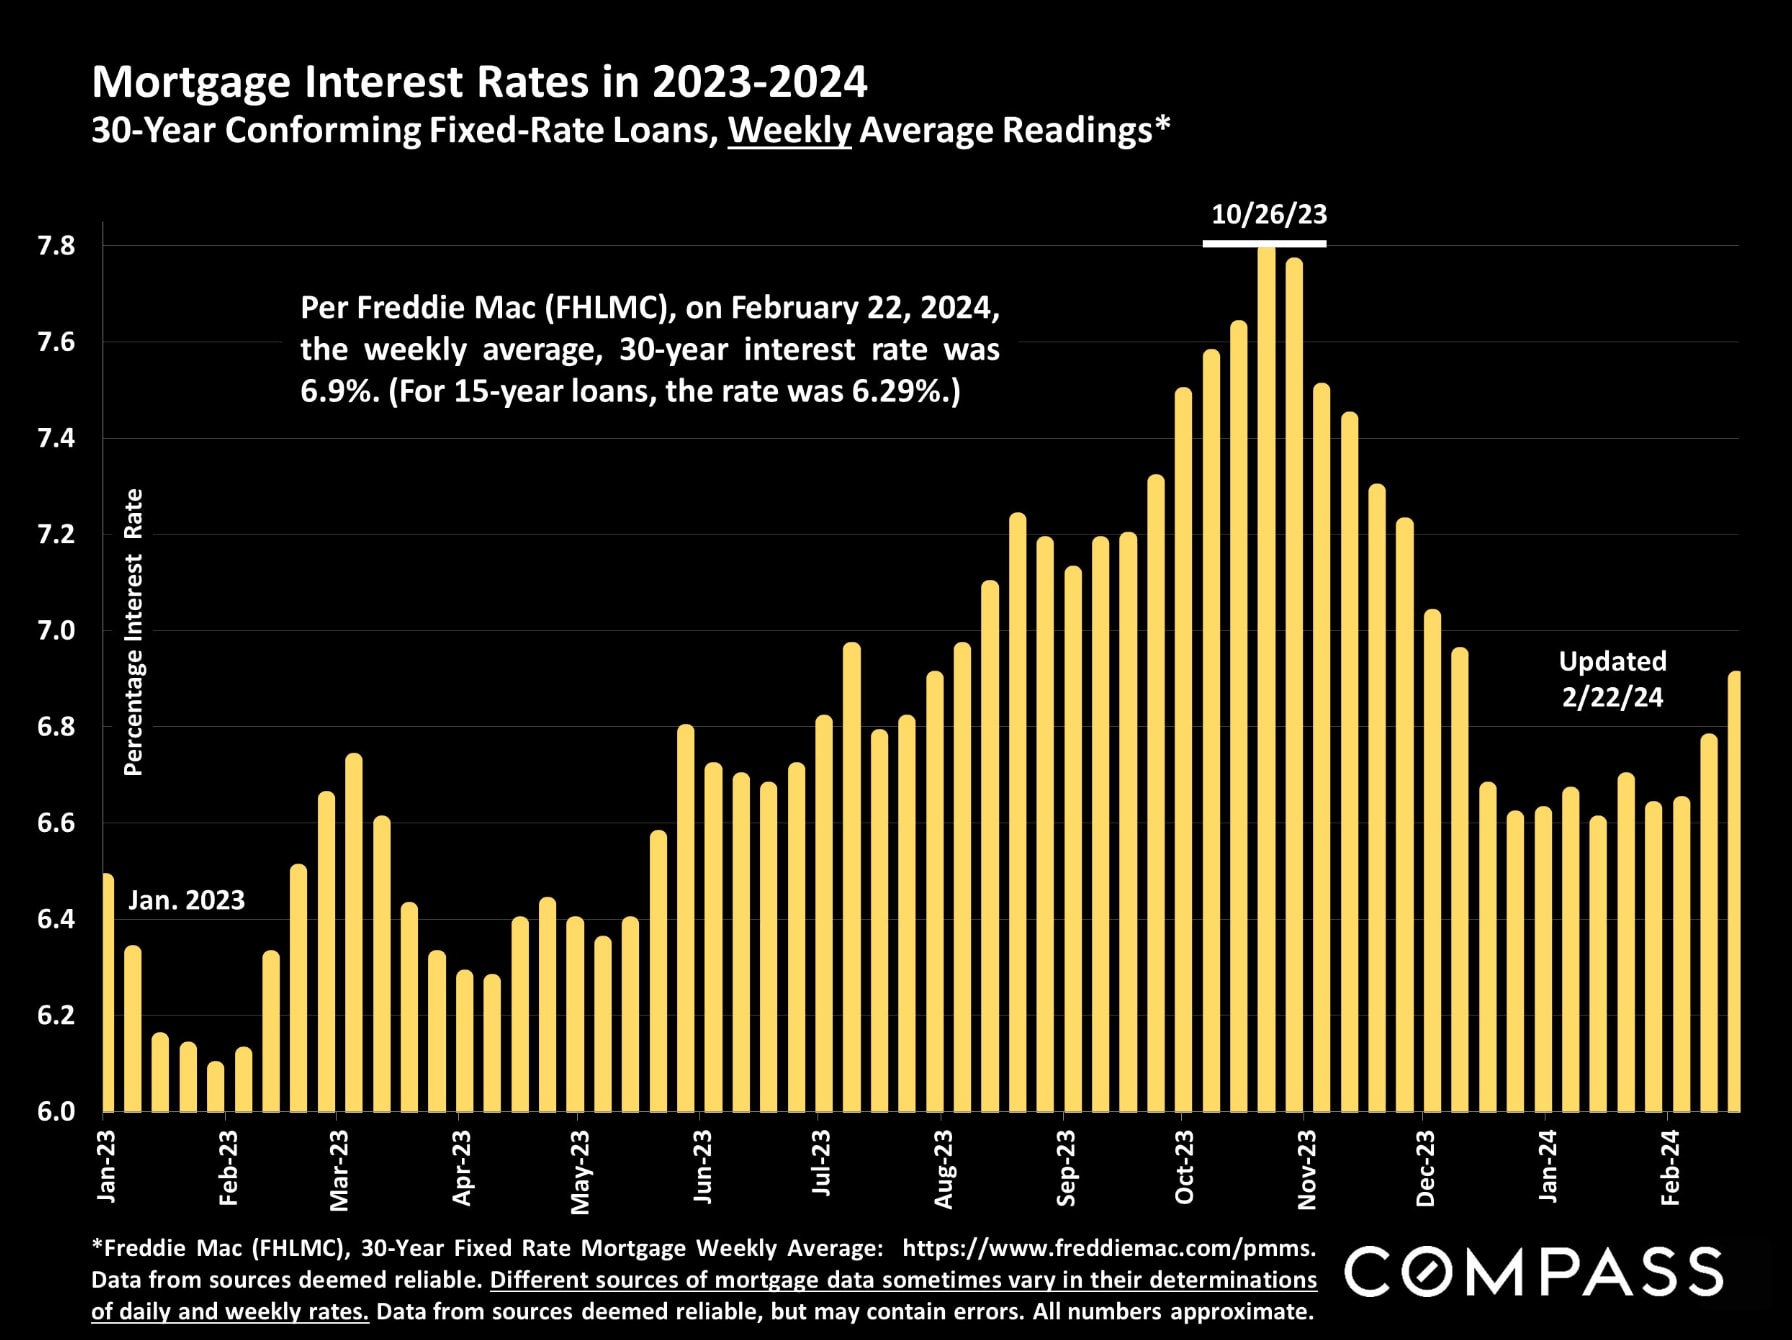
Interest rates are well below those seen late last year, but have started ticking up in mid-February.
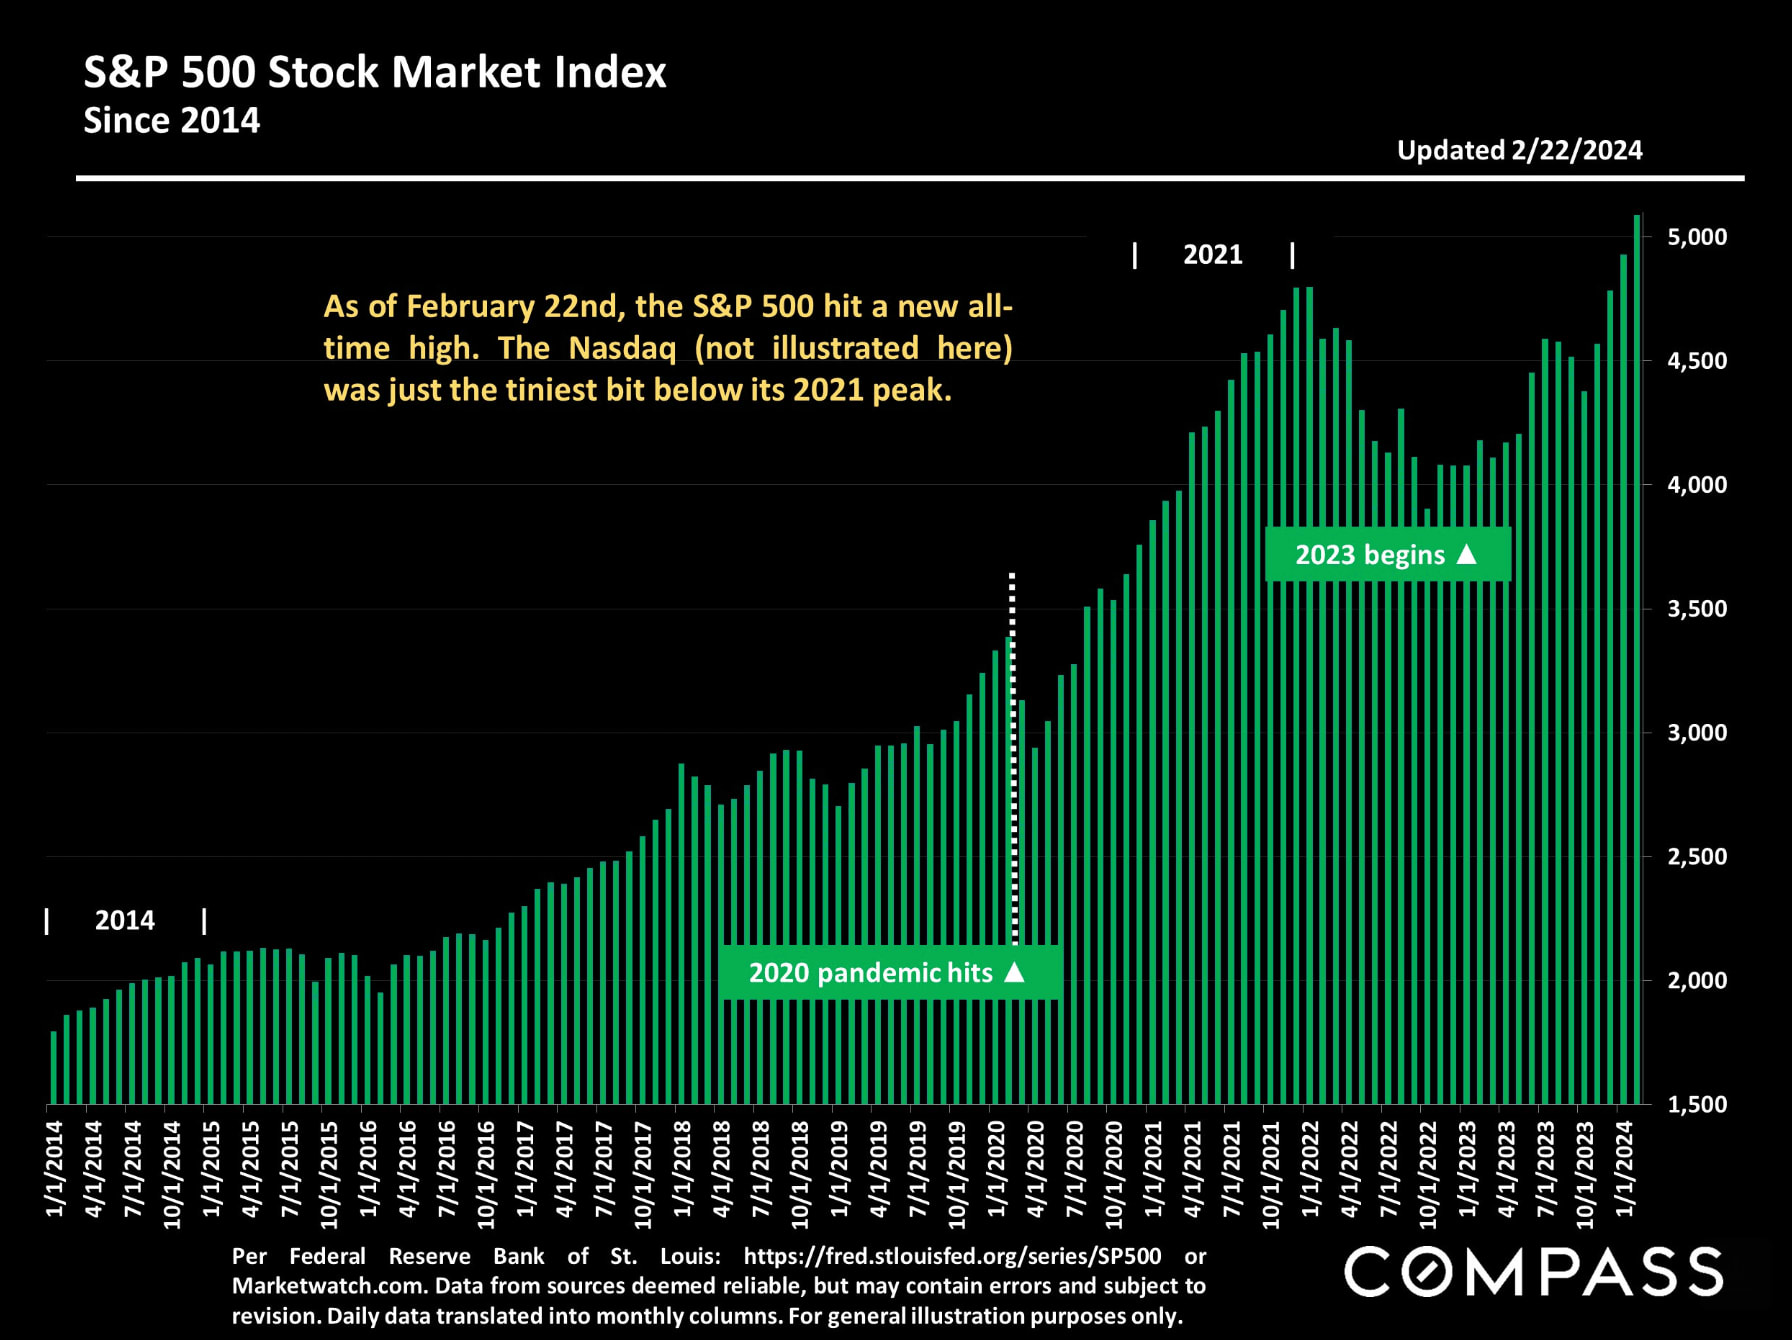
Through February 22nd, stock markets have continued to rebound dramatically, deeply impacting household wealth - especially among more affluent buyers.
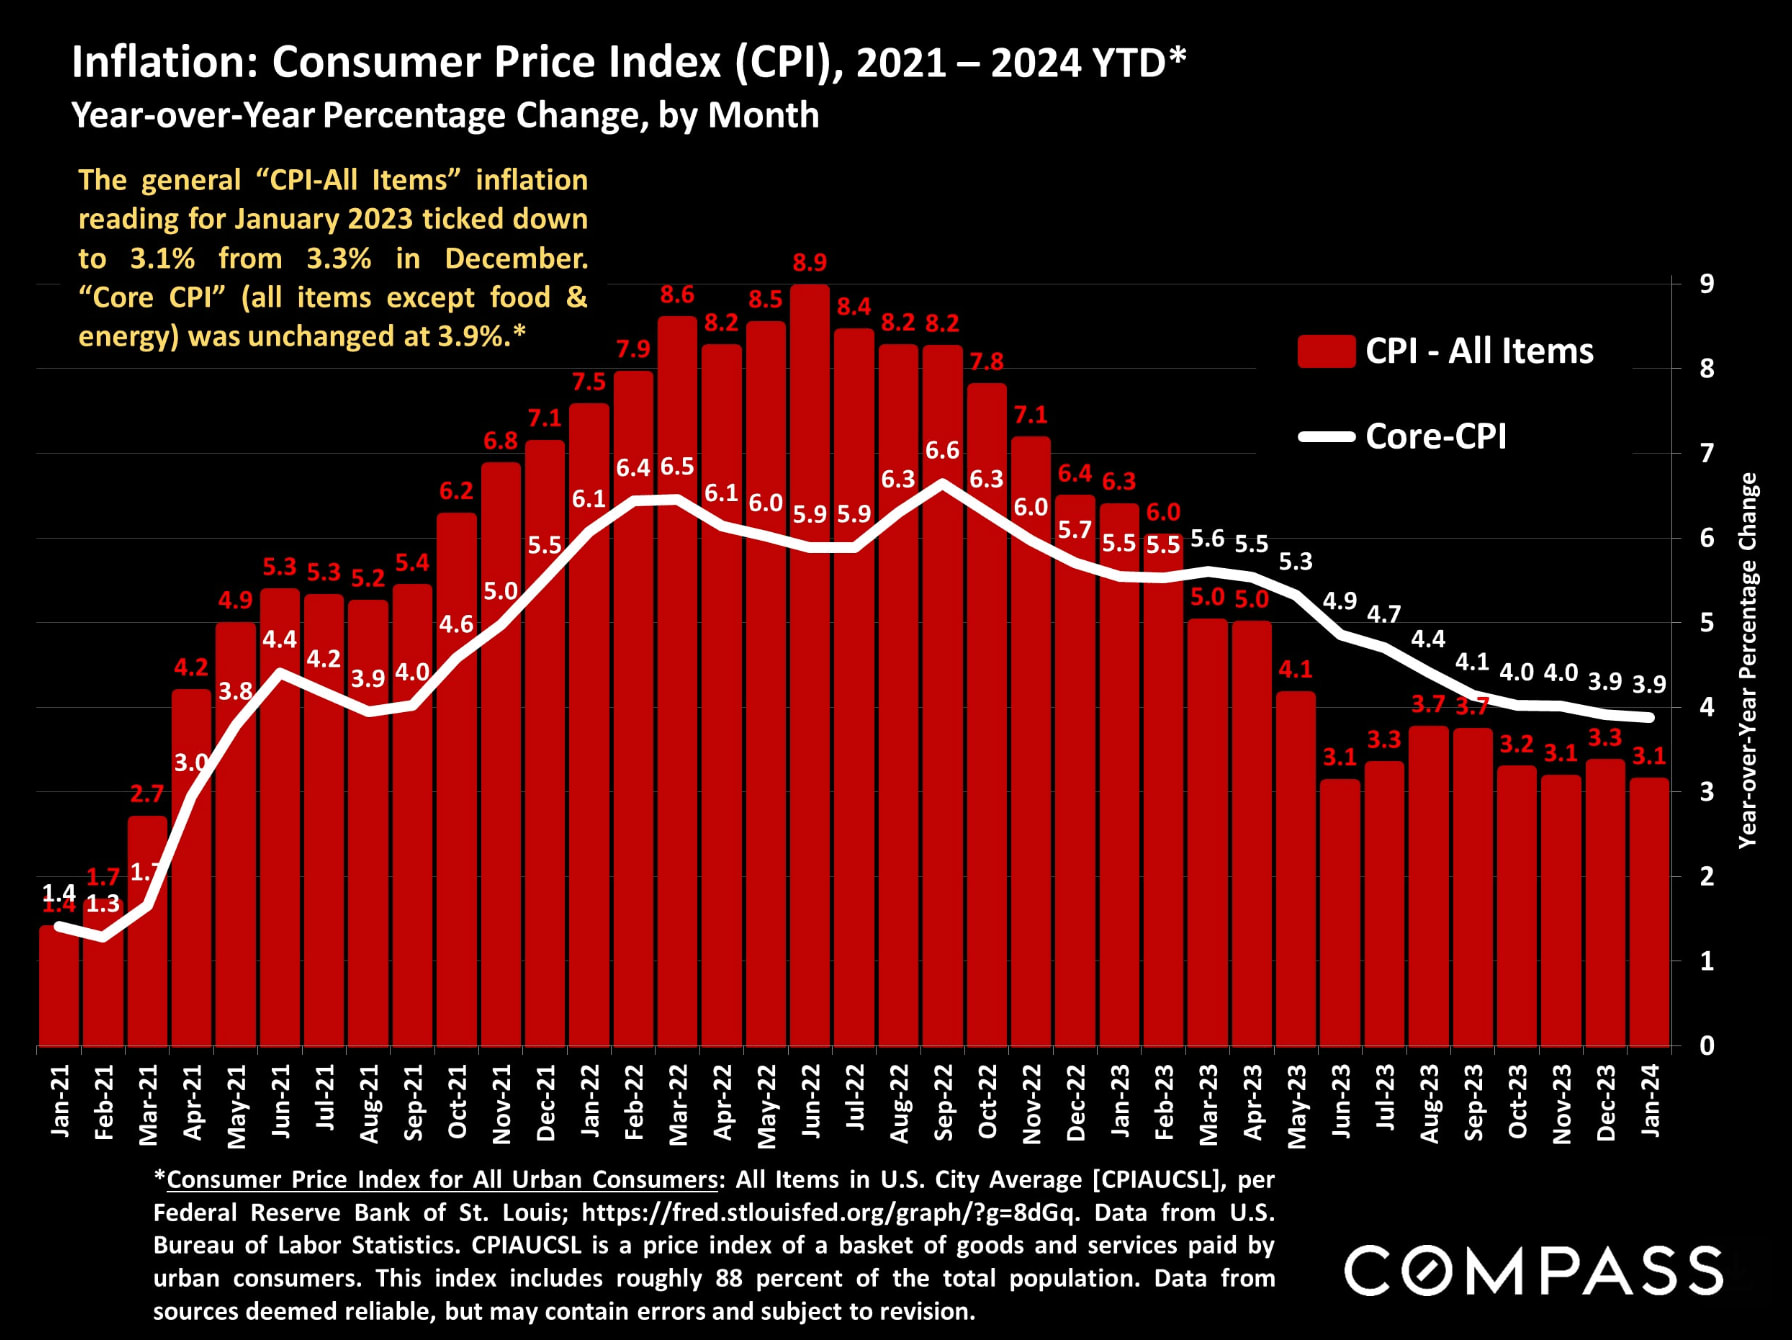
Having plunged from its peak in mid-2022, the inflation rate has not dropped as quickly as expected in recent months, a big factor in mortgage interest rates.
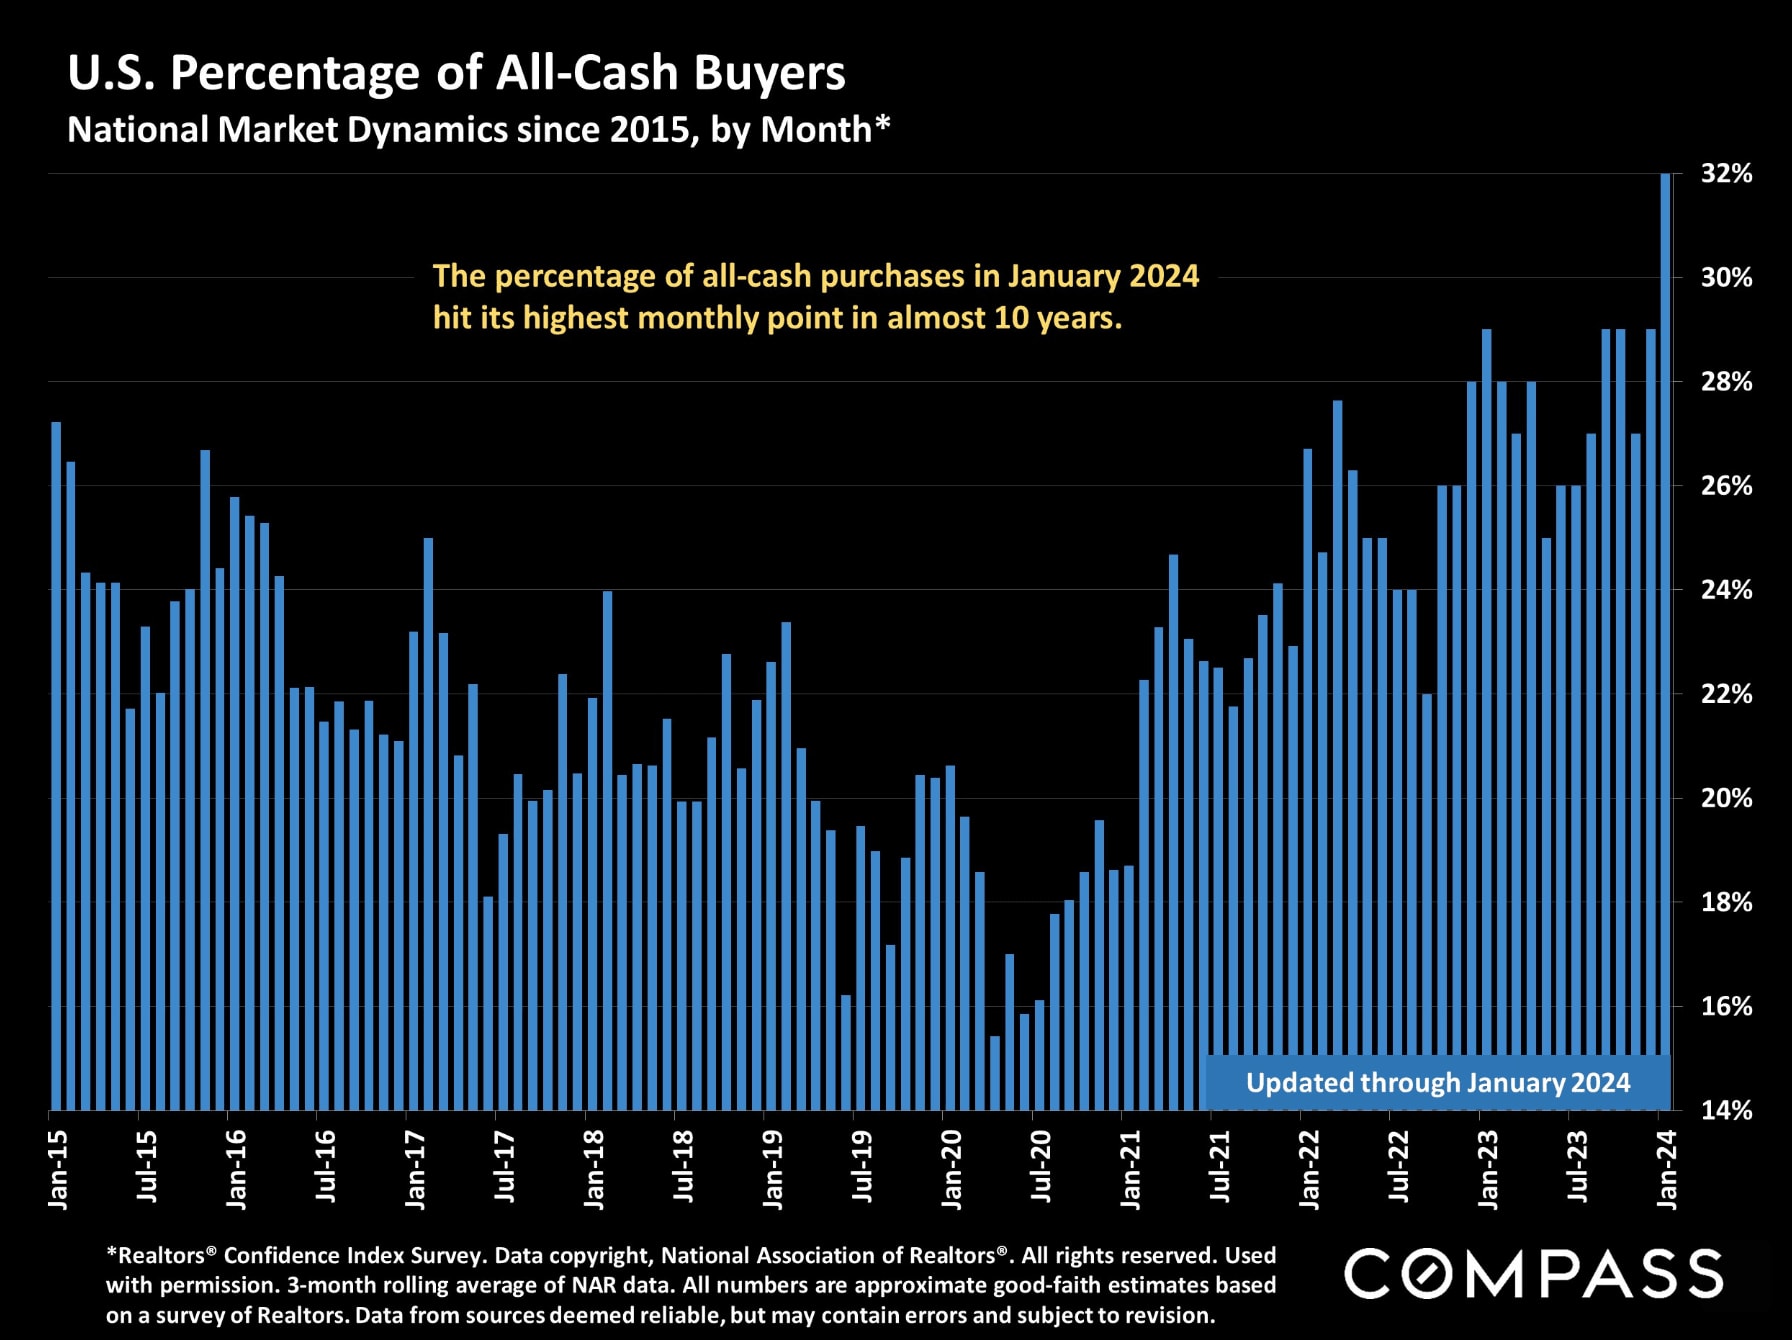
As a percentage of total sales, the share of transactions being completed by buyers paying all cash has continued to climb.
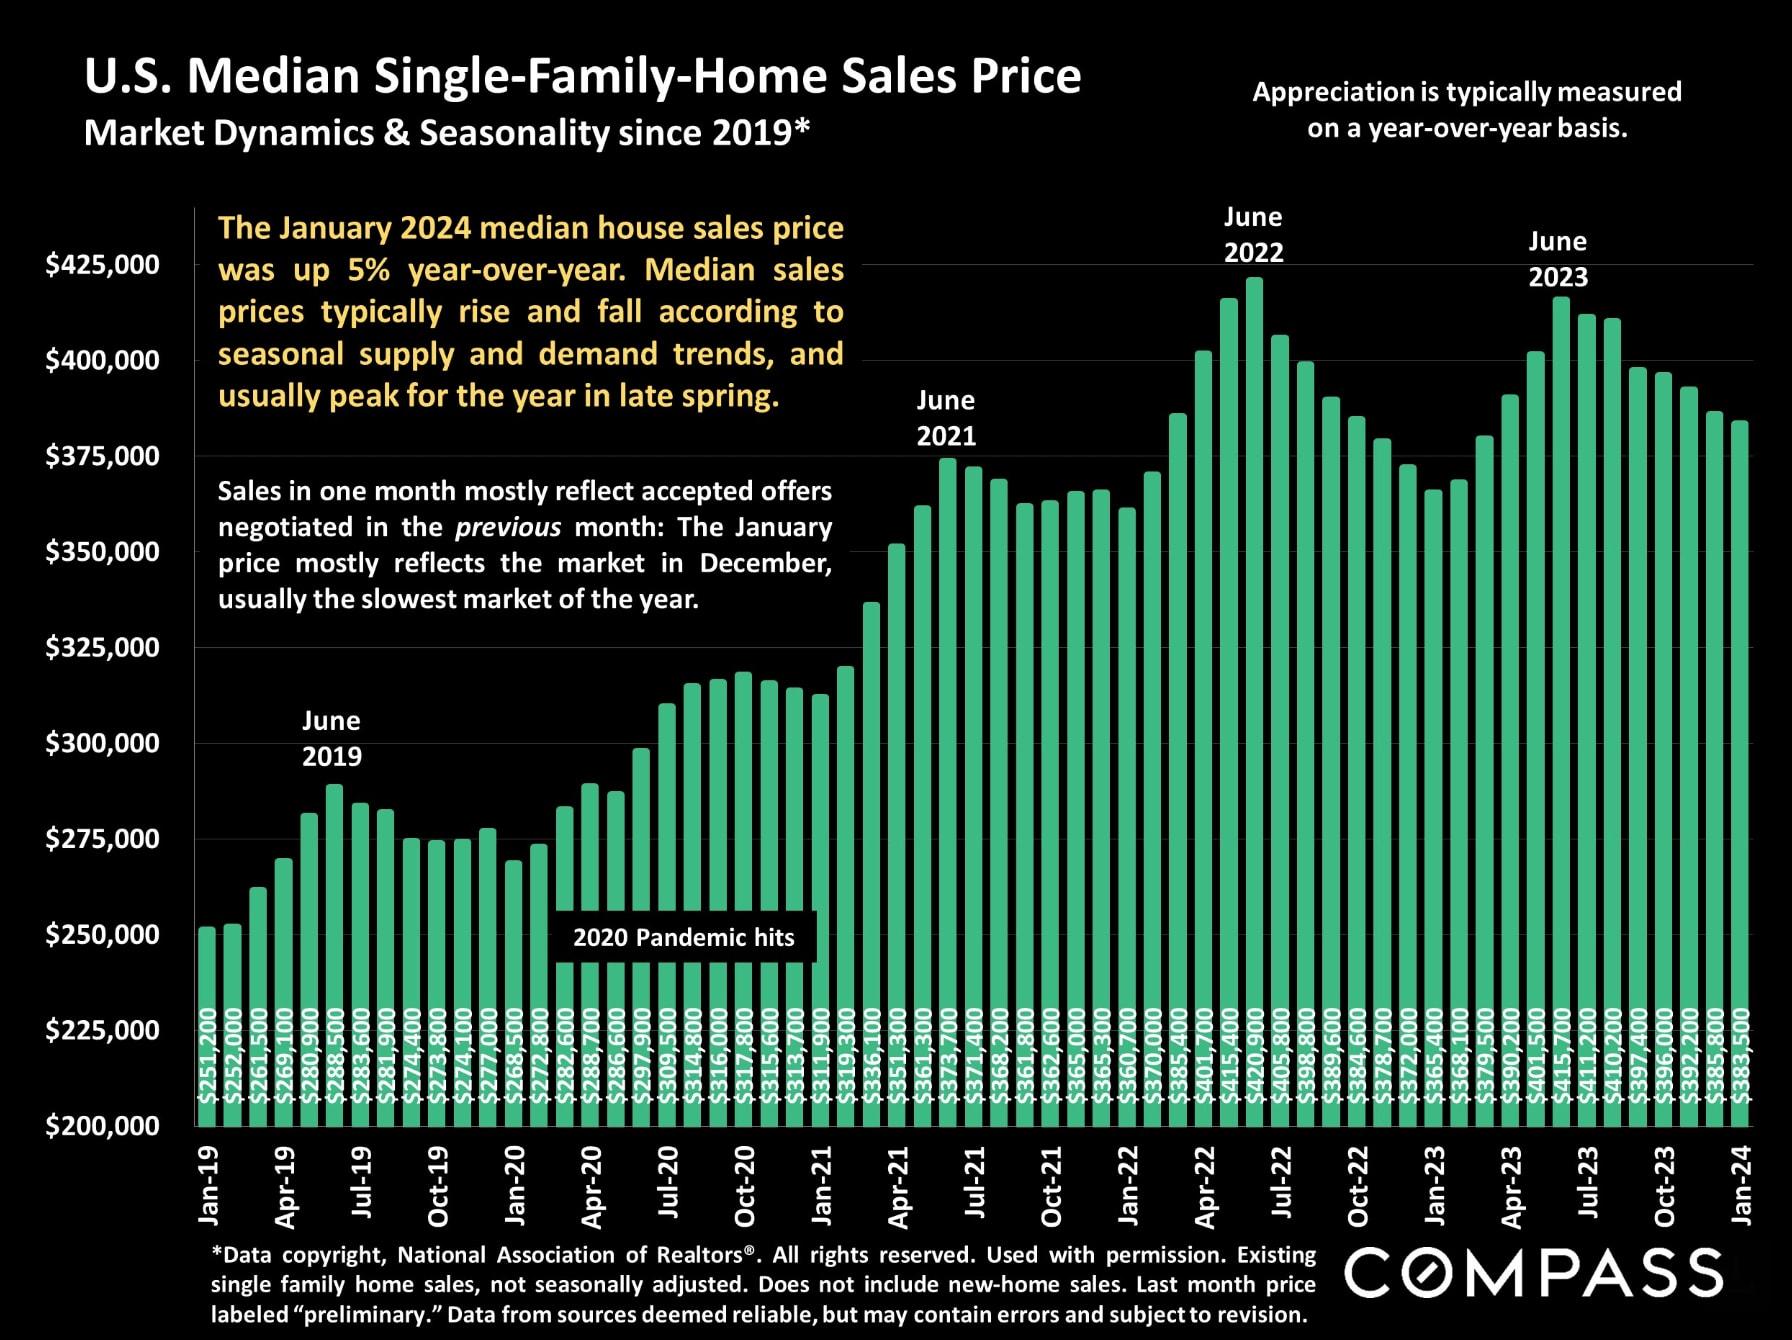
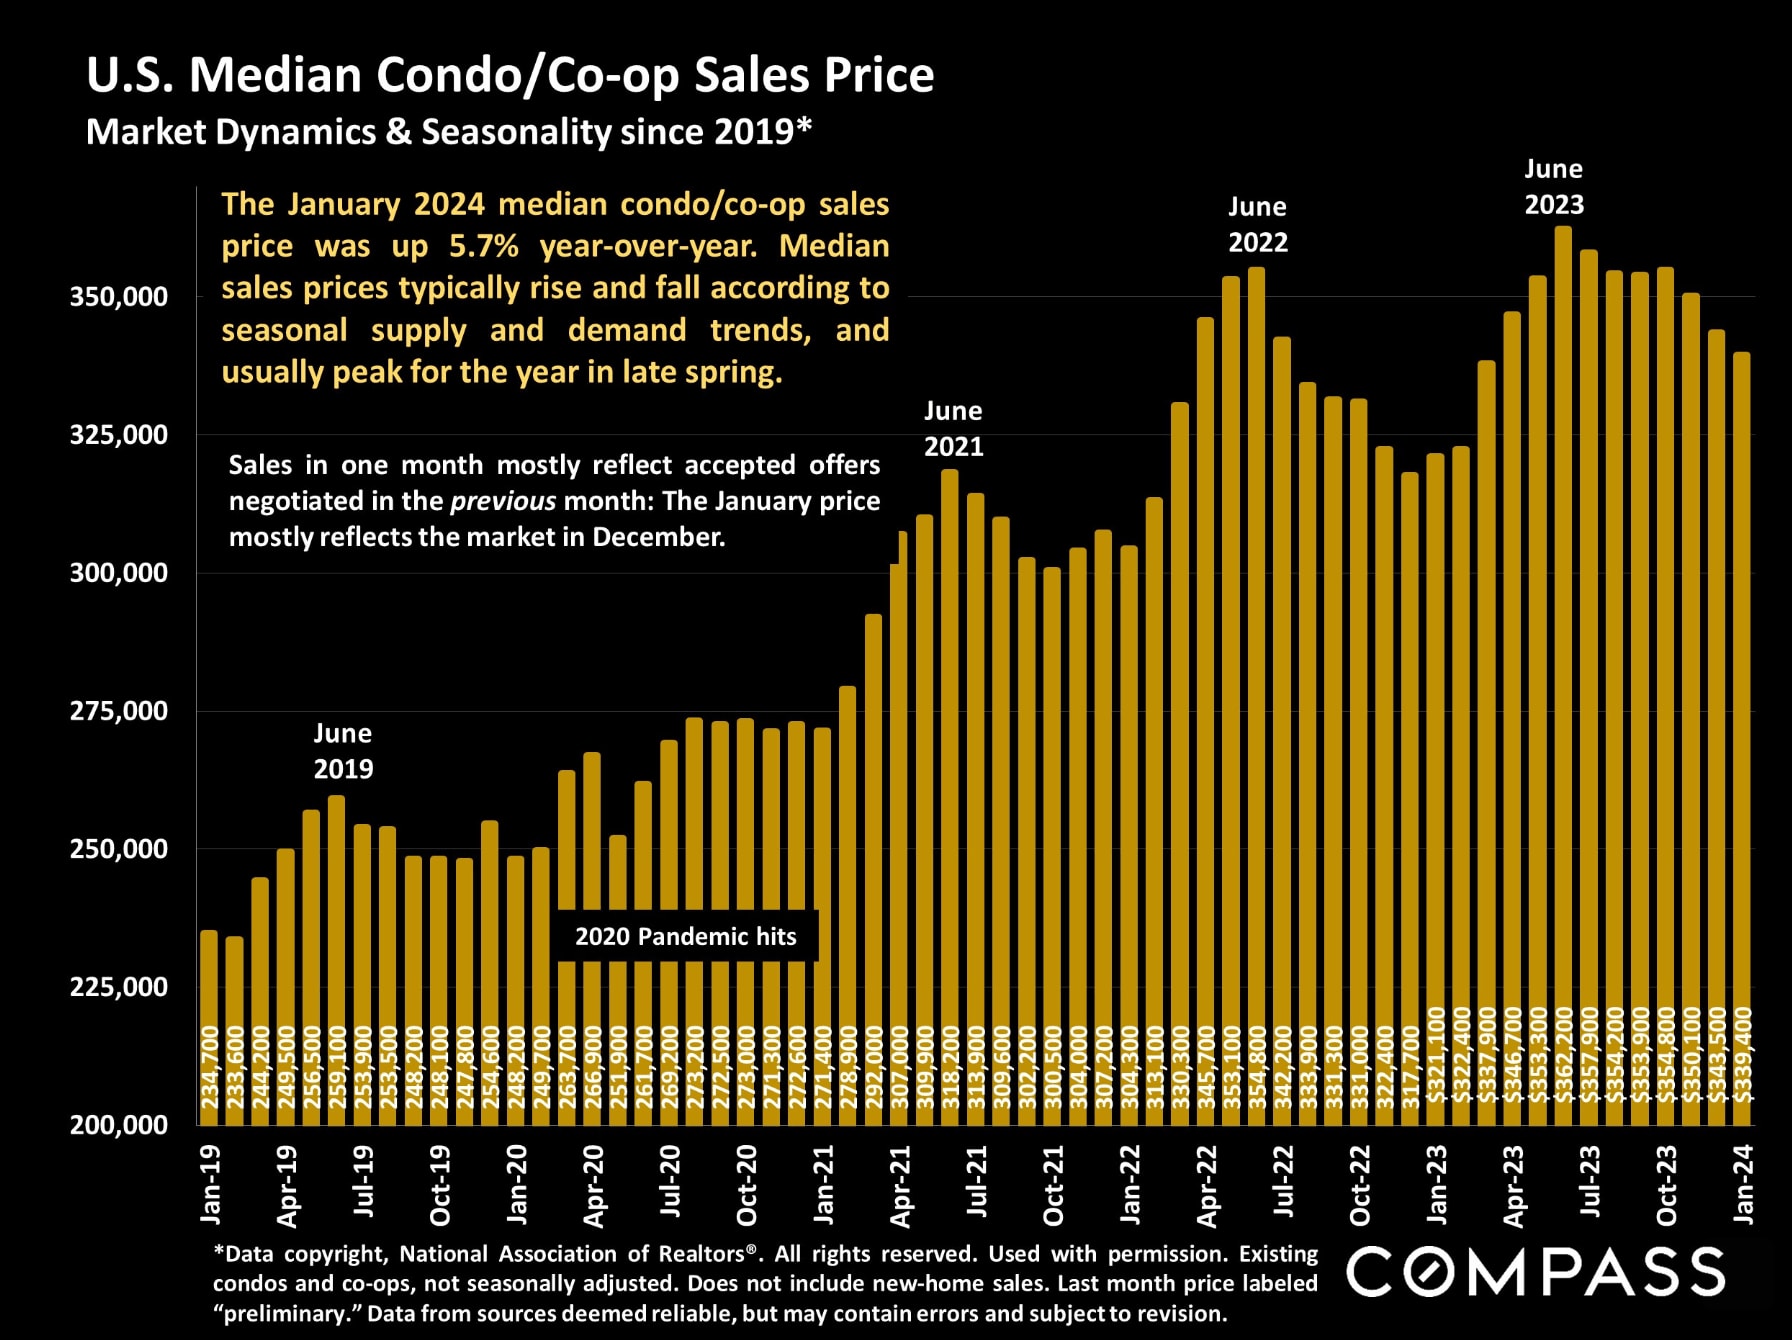
Median home sales prices rise and fall to seasonal supply and demand dynamics, and January prices mostly reflect the slow December market. Still, U.S. house and condo/co-op prices were up 5% & 5.7% respectively year-over-year.
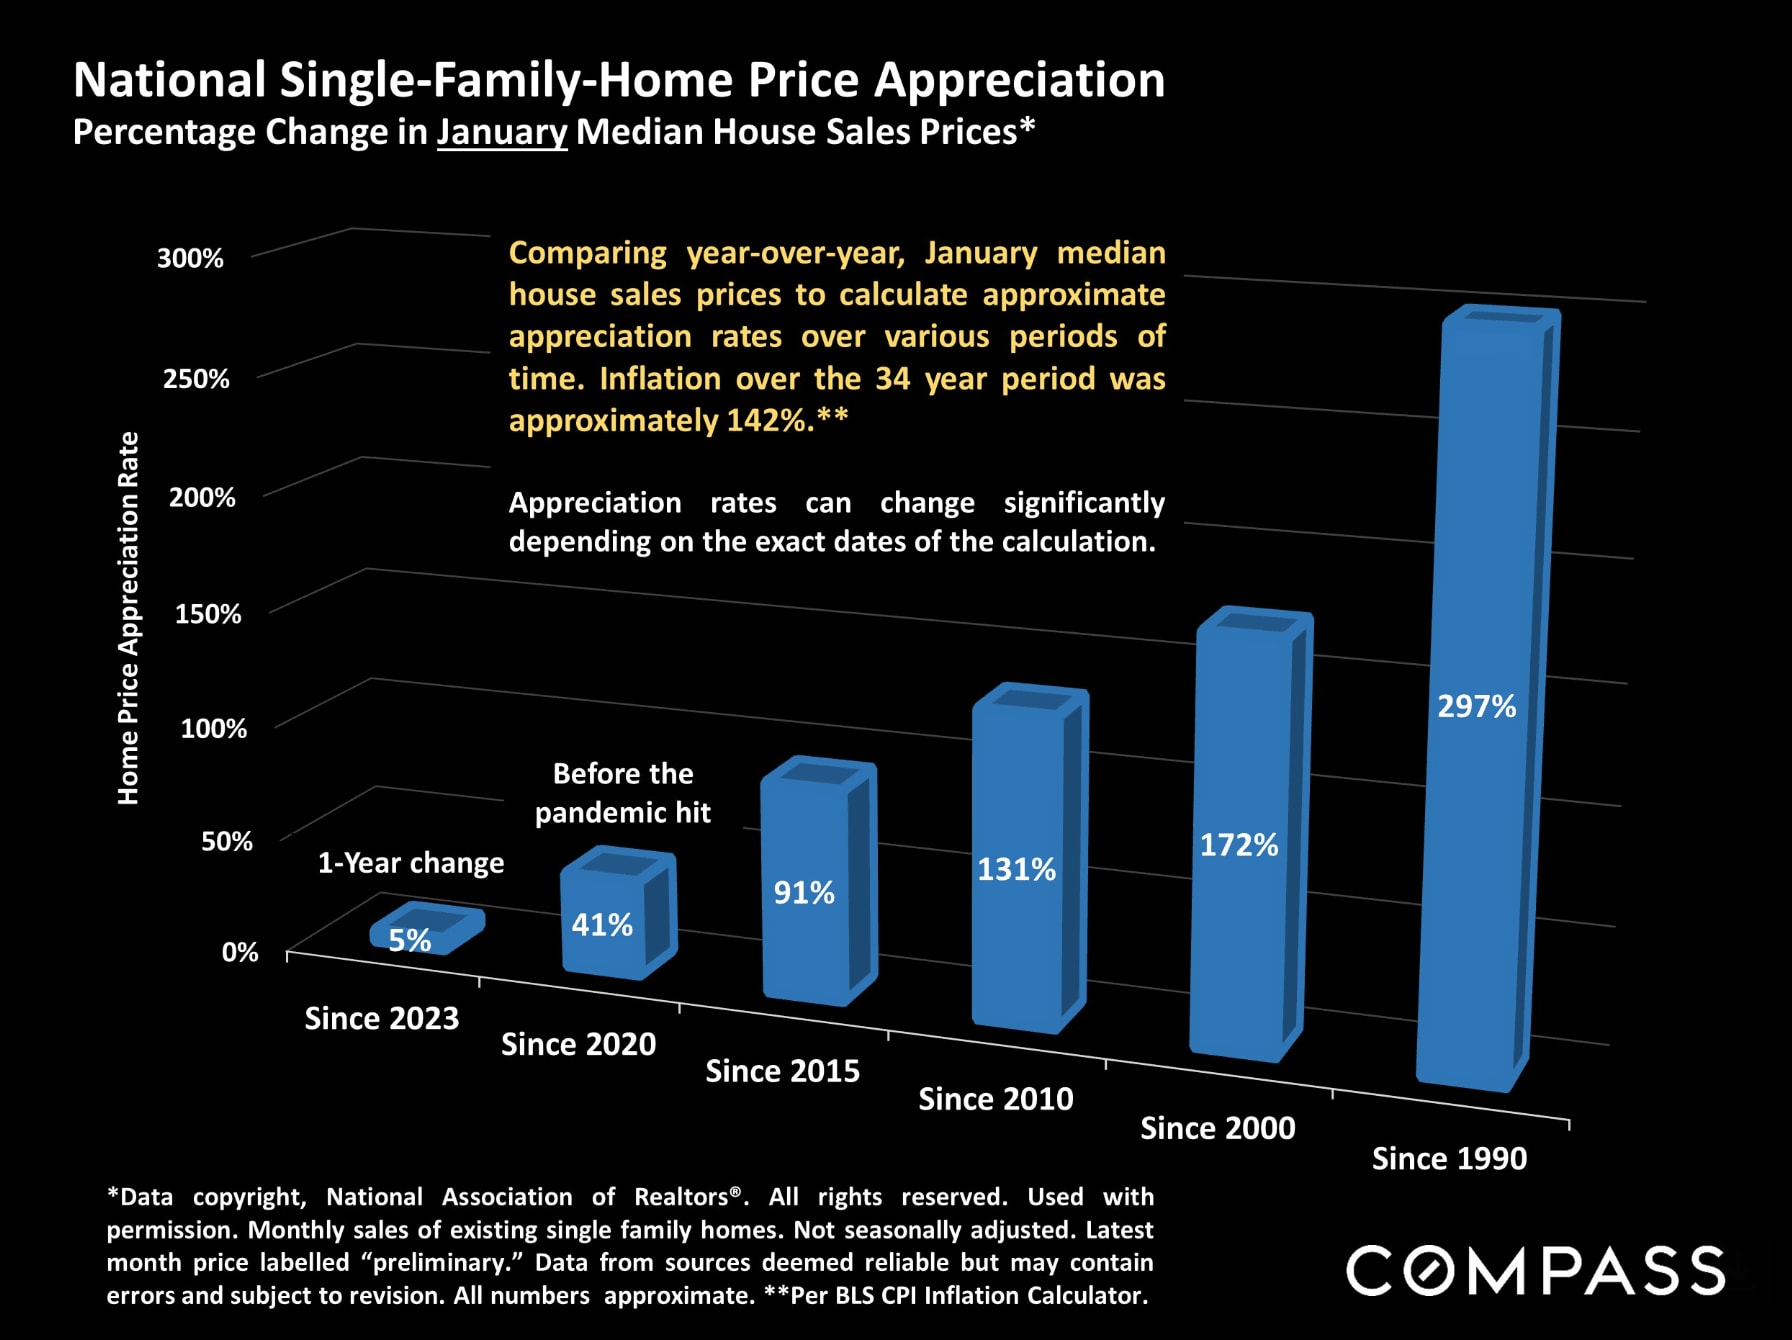
National house-price appreciation rates over various periods since 1990.
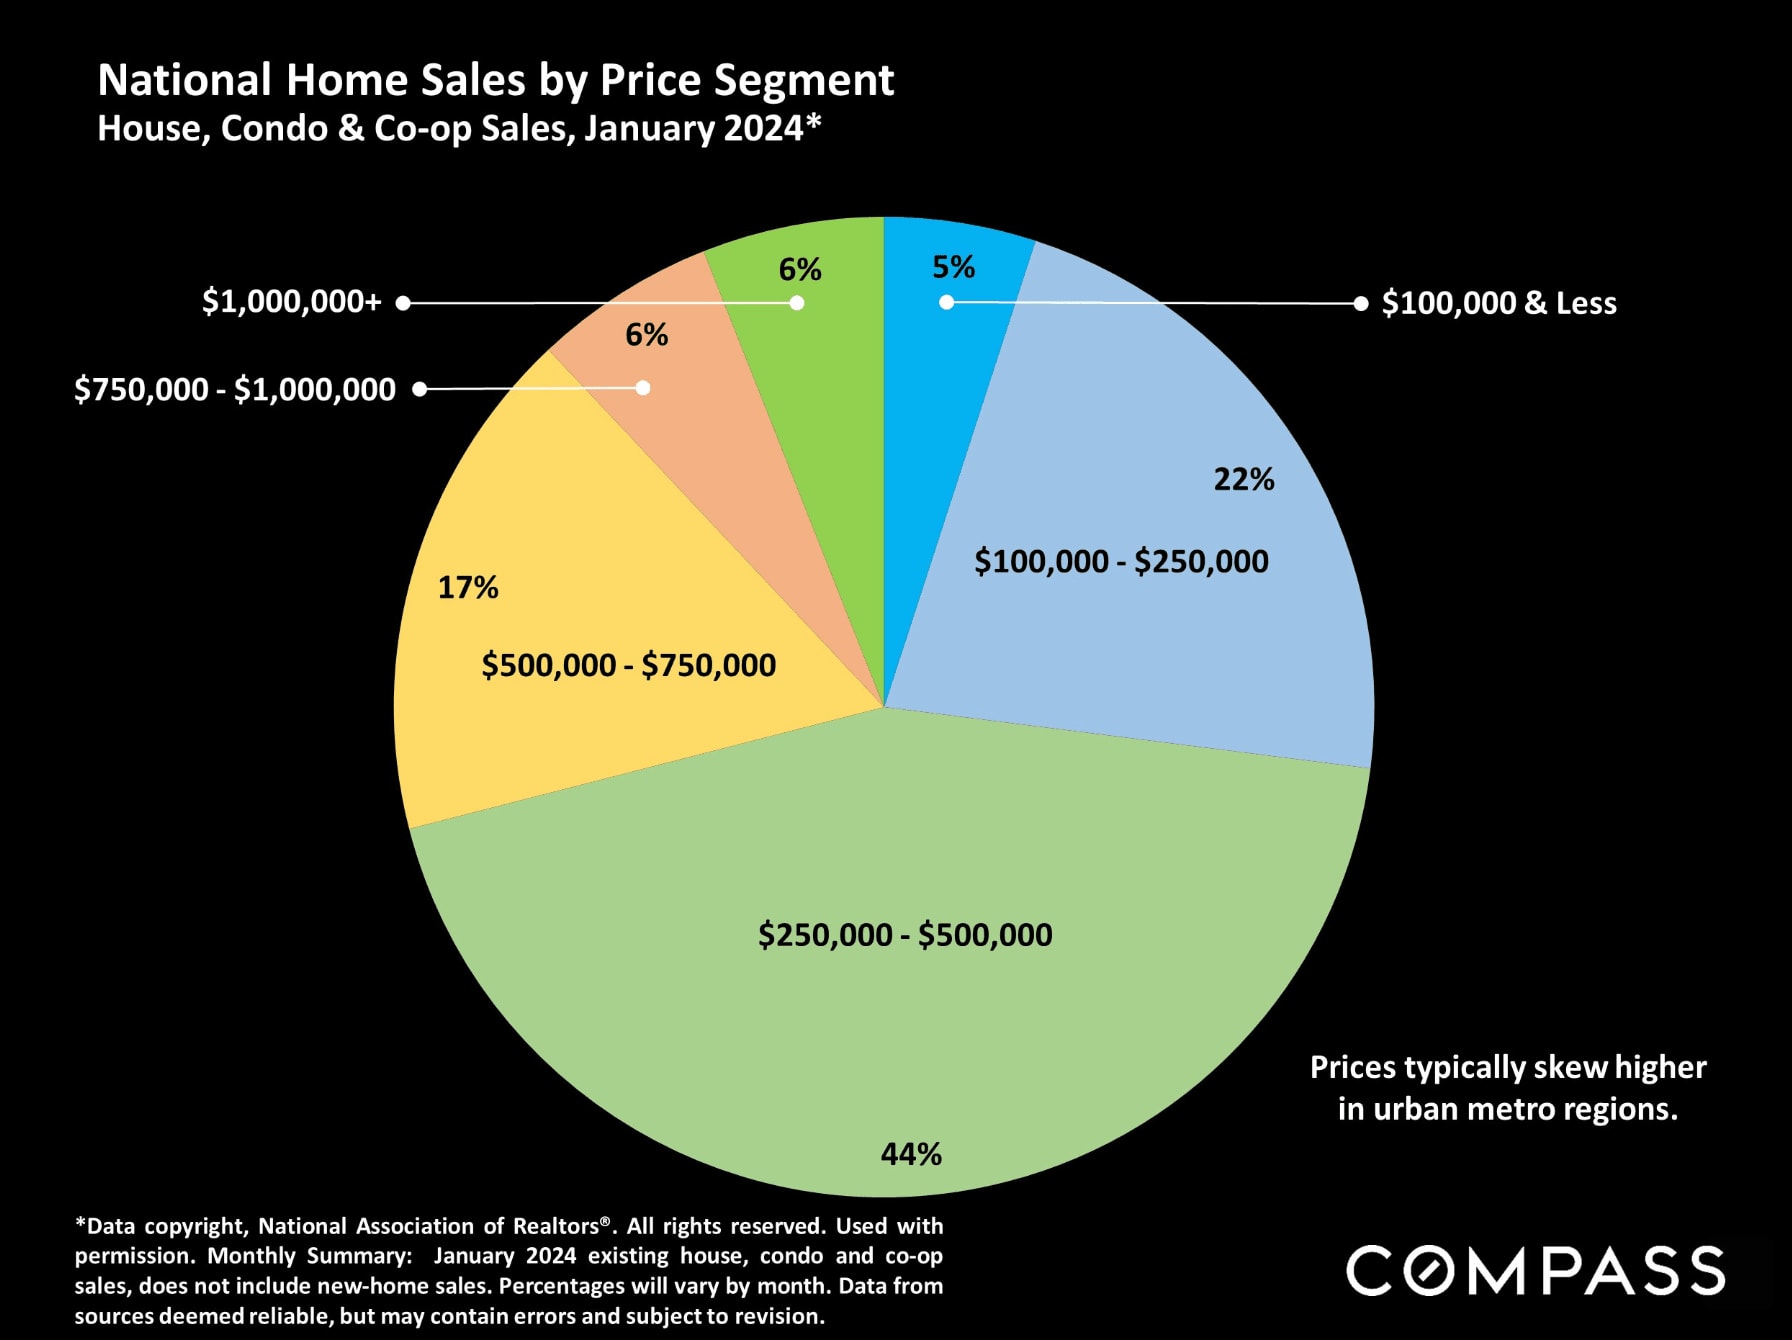
Home sales by price segment: Higher-price segments have recently seen by far the largest year-over-year increases in sales.
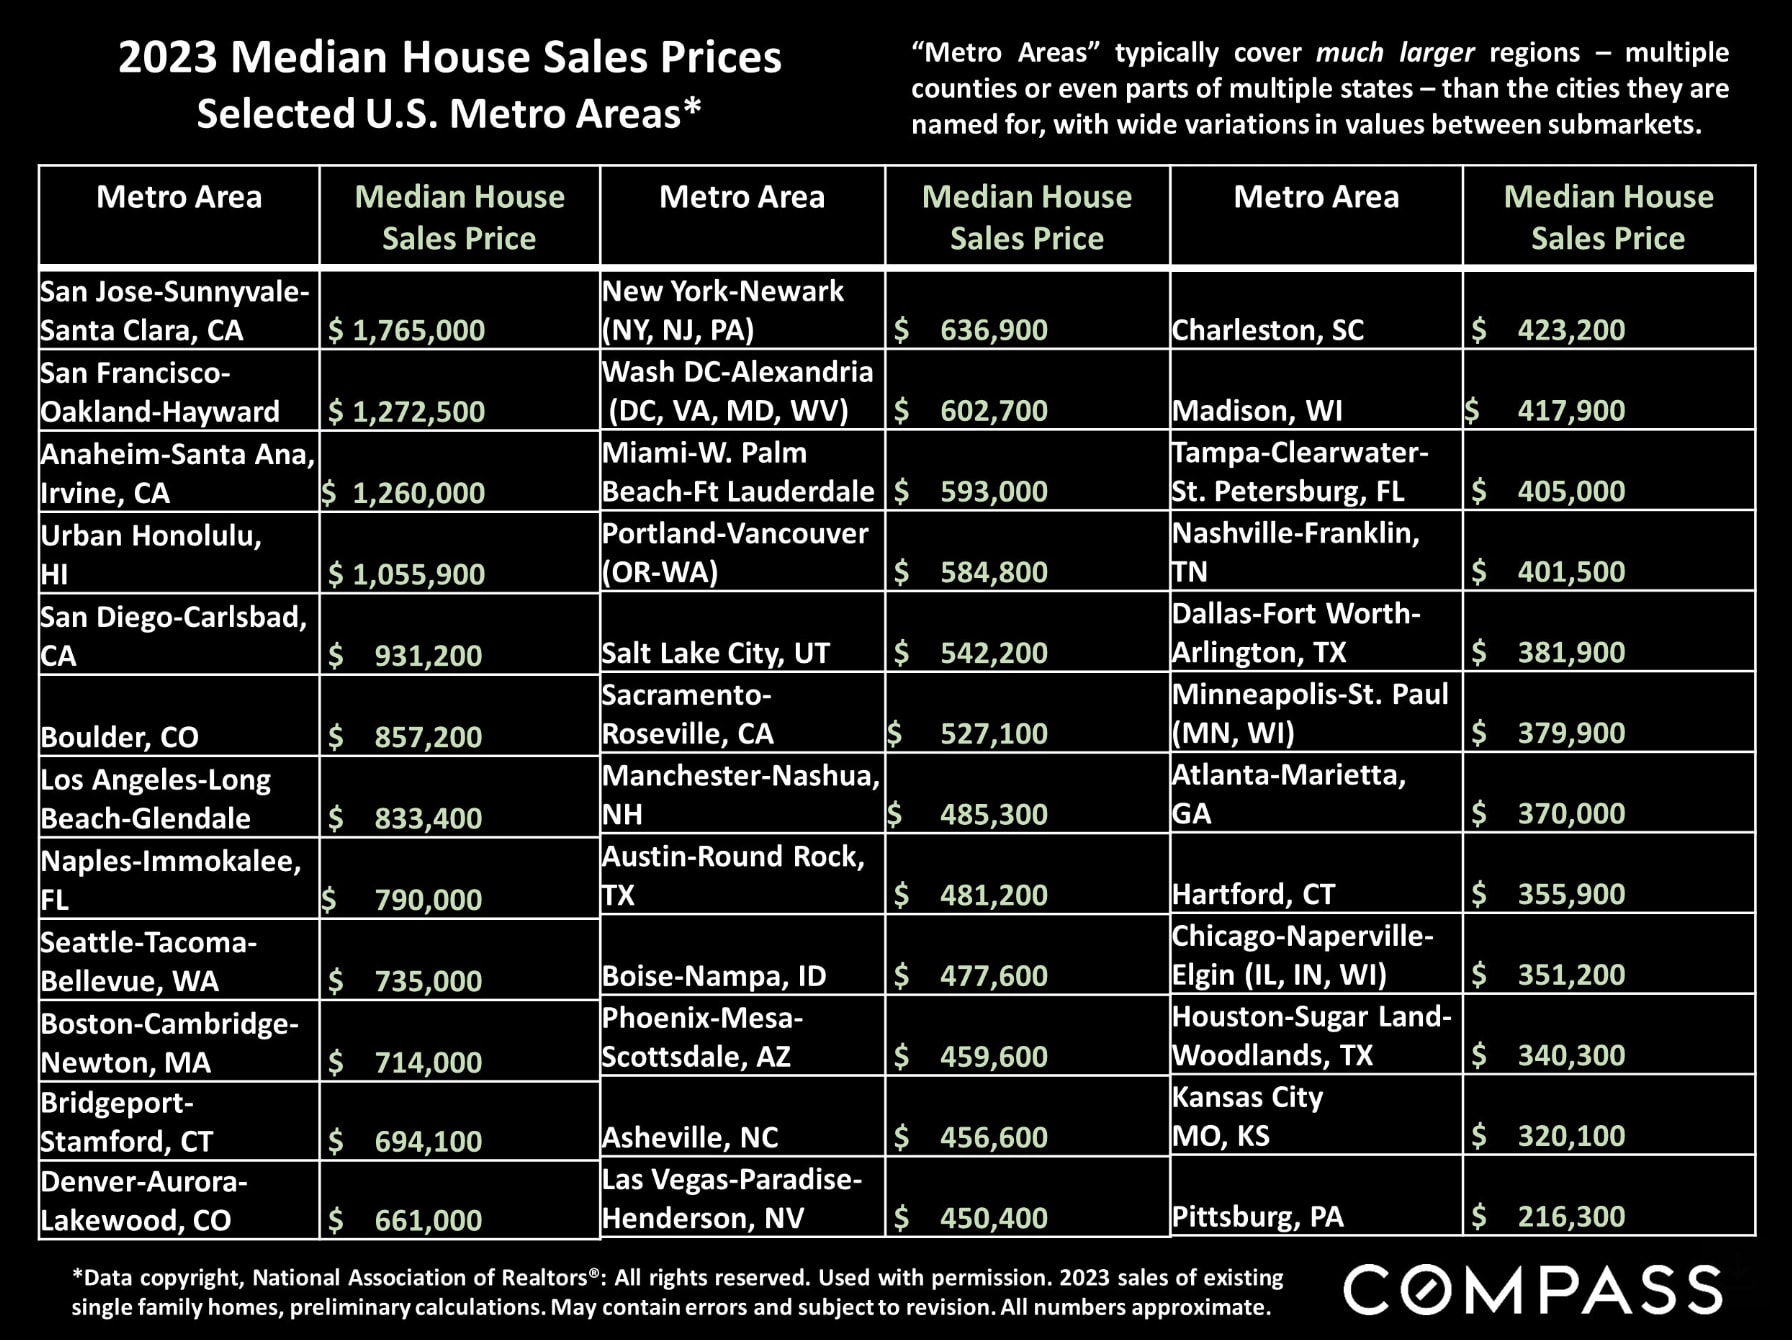
Median house prices in selected U.S. metro areas. "Metro areas" typically consist of large, multi-county regions.
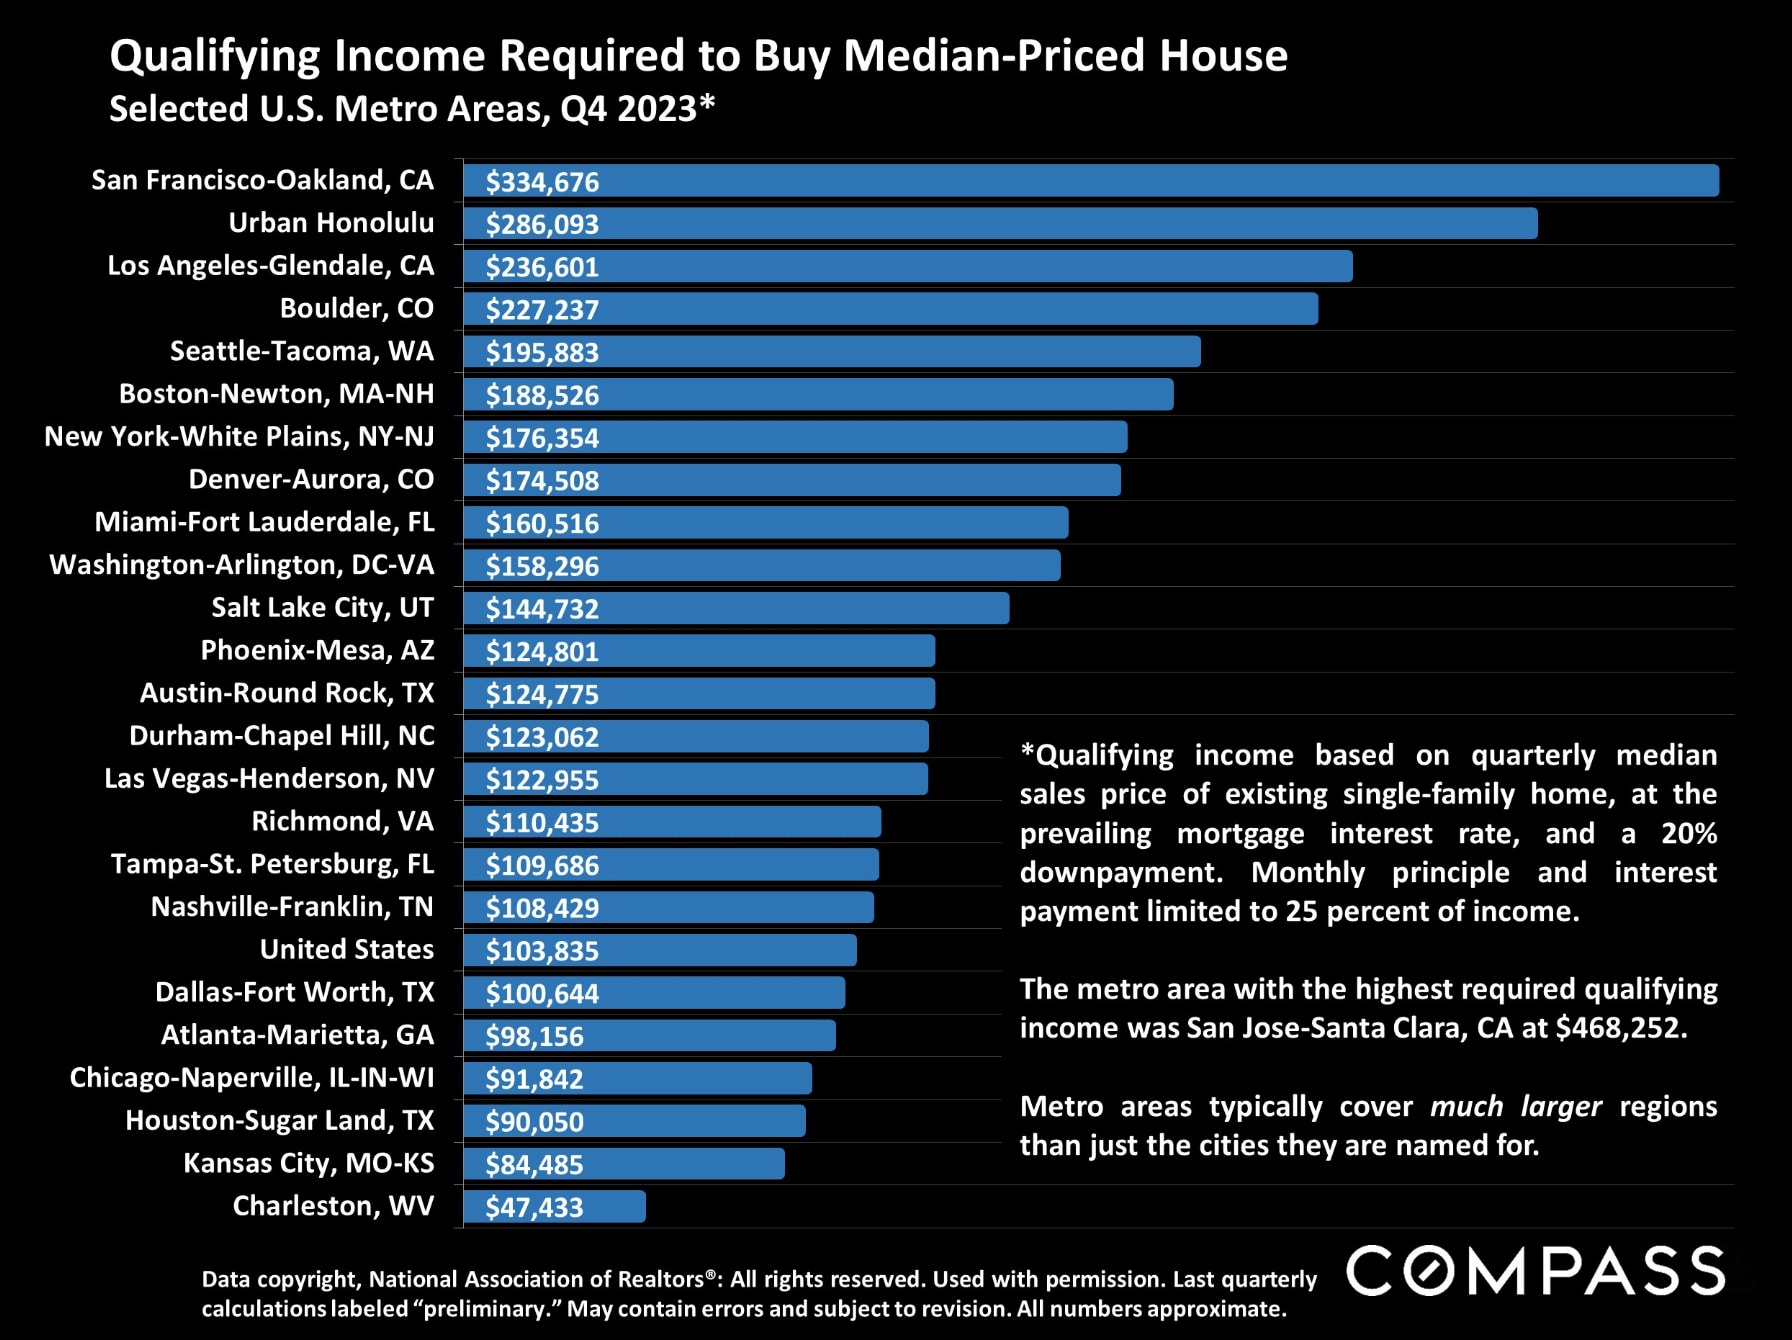
And a look at the approximate income required to buy a median-priced house in various U.S. metro areas, based on a 20% downpayment.
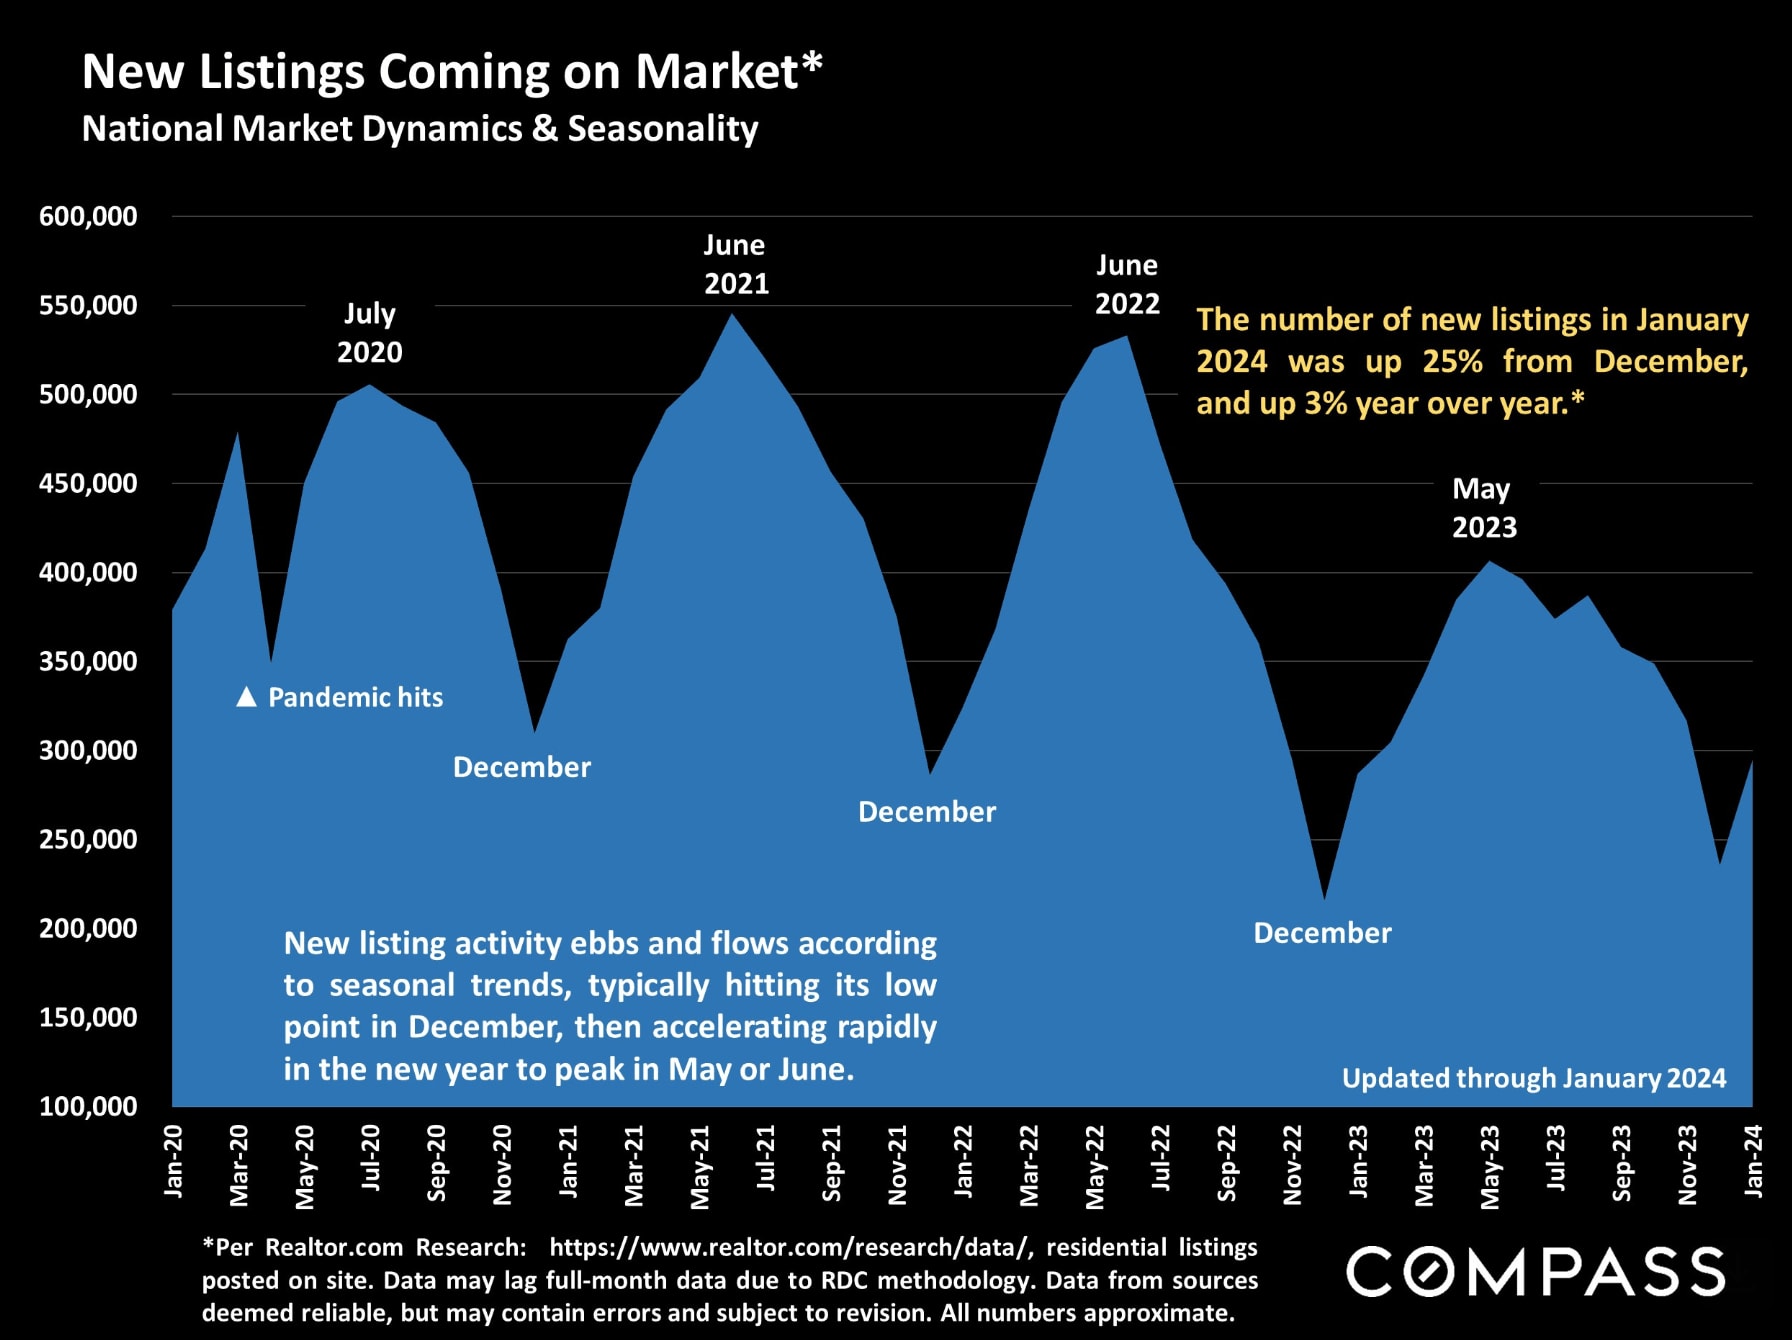
As the new year's market wakes up, the number of new listings is spiking, but, so far in 2024, not enough to meet the acceleration in buyer demand. Since mid-2022, listing activity has plummeted due to the mortgage lock-in effect, but many analysts predict higher listing volumes this year.
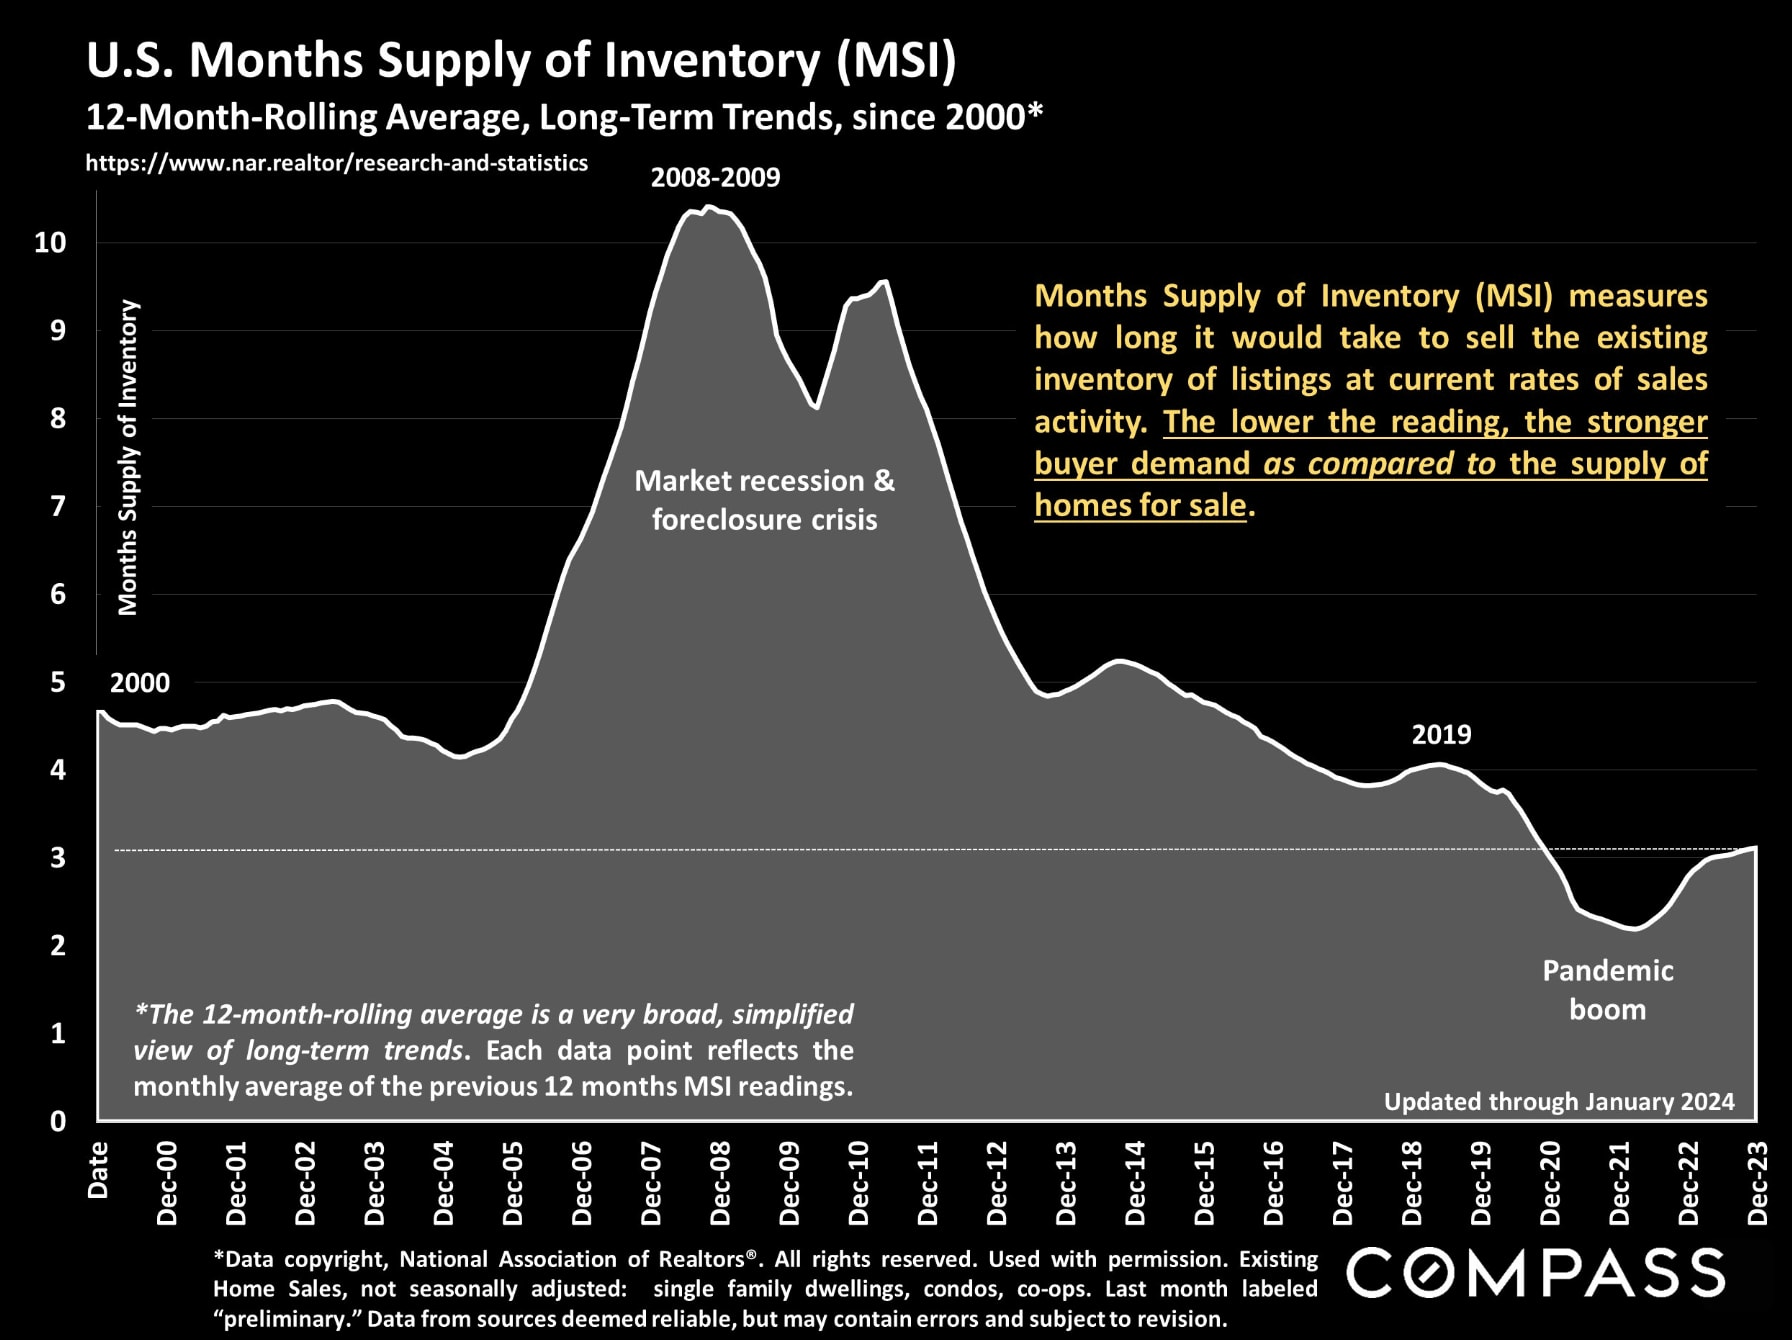
Months-Supply-of-Inventory measures supply as compared to demand: The lower the MSI, the more heated and competitive the market. During the pandemic boom, soaring demand dropped MSI to historic lows; since mid-2022, the plunge in listings has been the main factor in keeping MSI so low by historical standards.
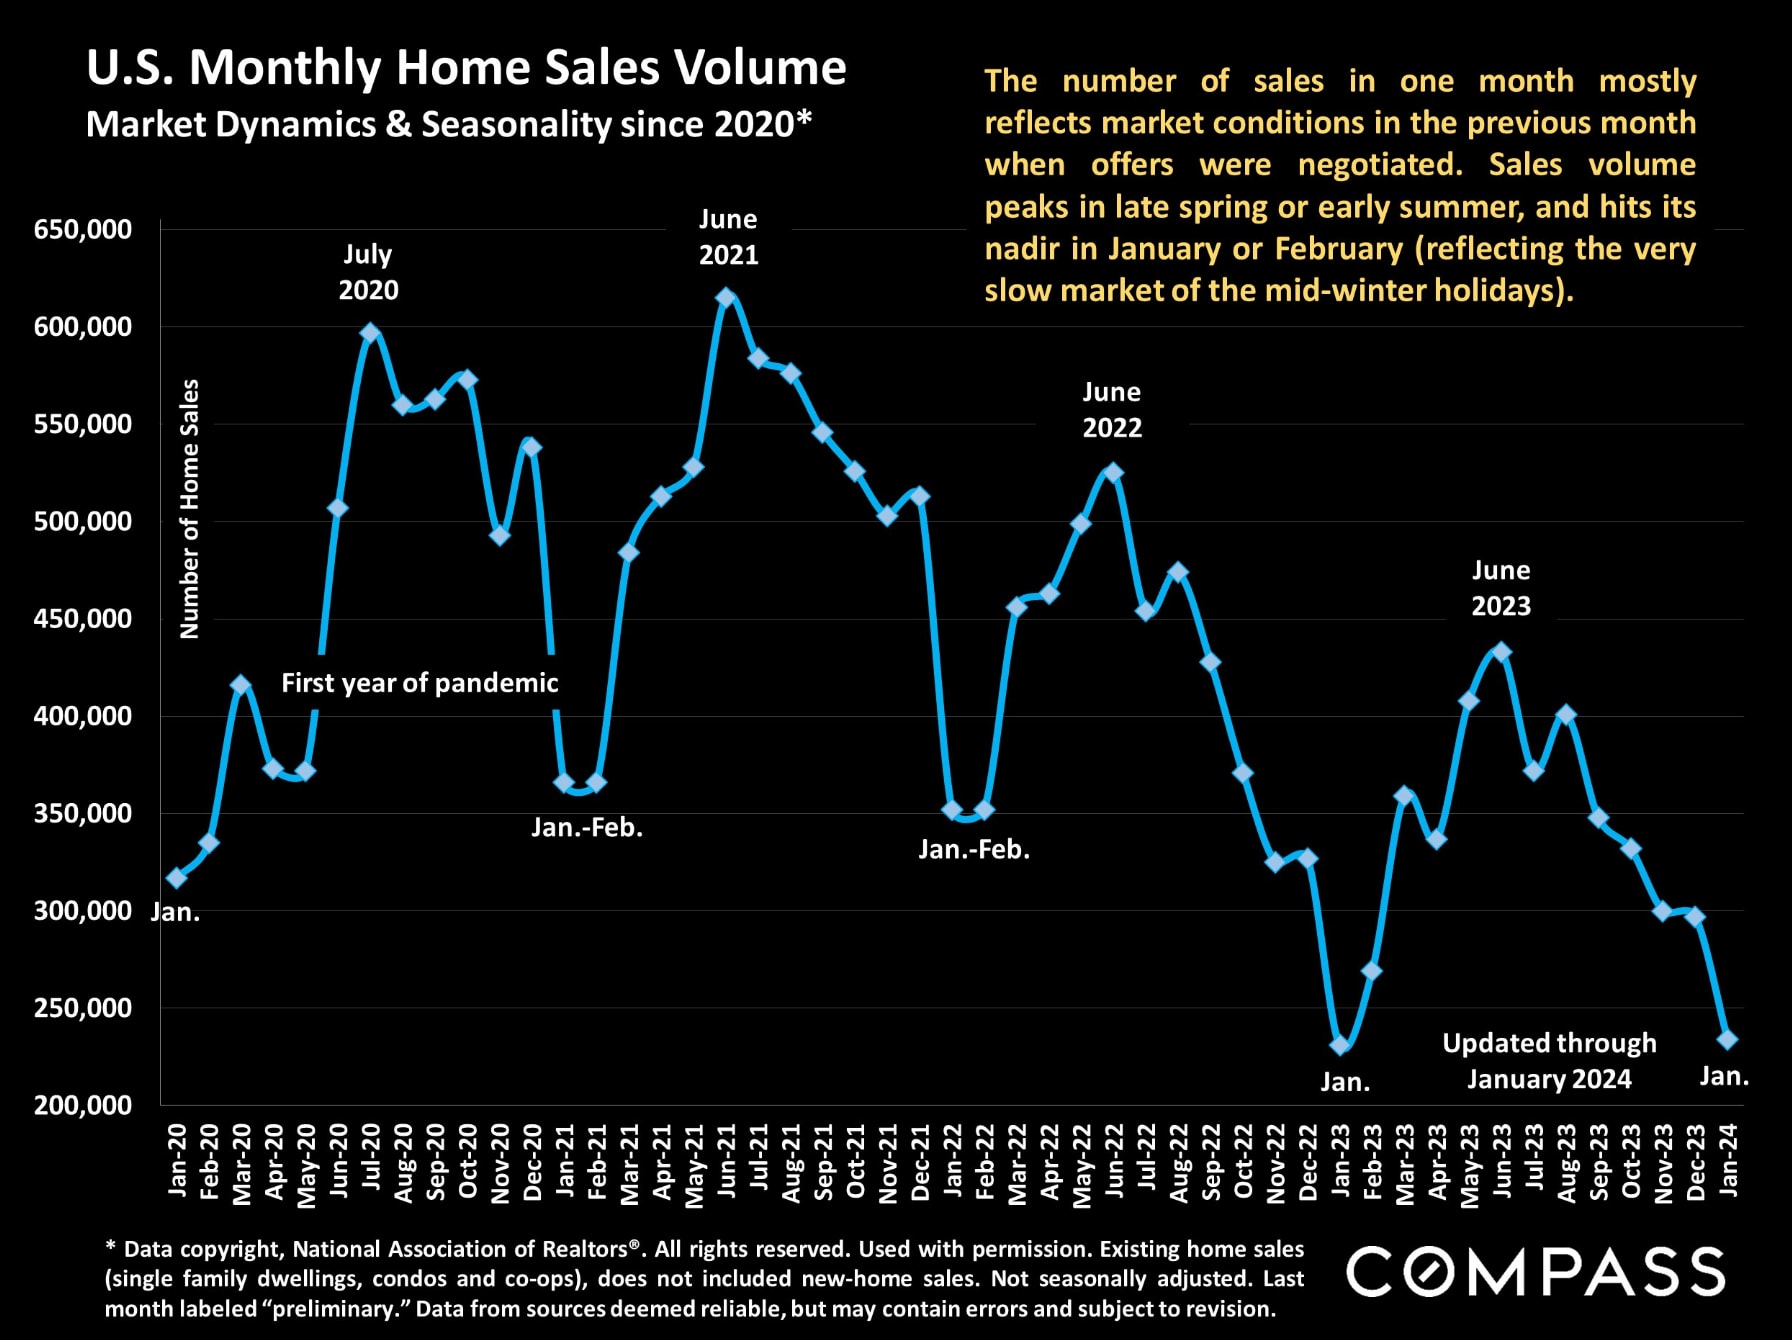
January sales volume reflects the very slow market of December, but moving into spring, the monthly number of sales should begin rising quickly. Click on the image below for our overview report on market seasonality.
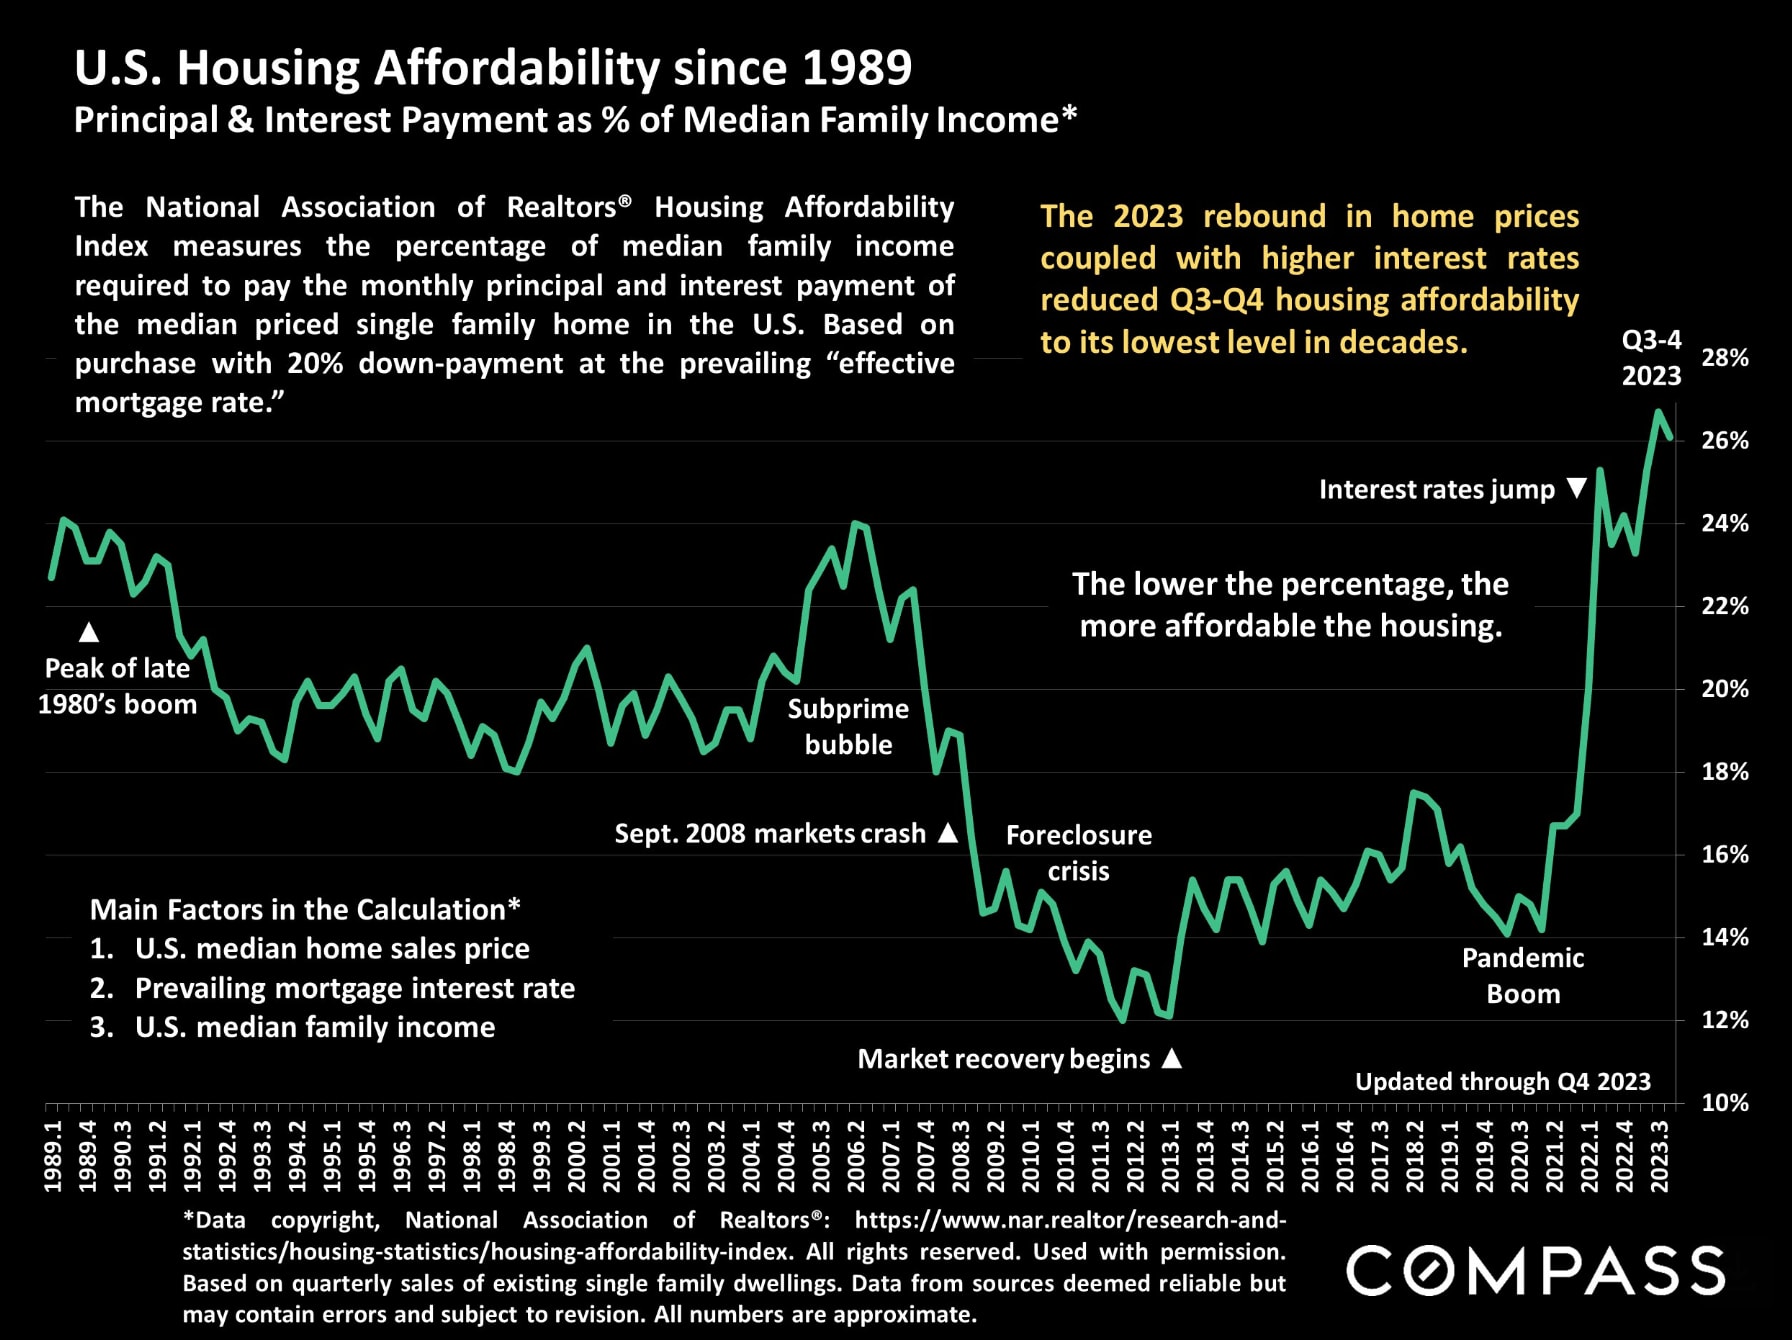
Strong demand vs. an inadequate supply of homes for sale, plus higher interest rates, have severely impacted housing affordability.
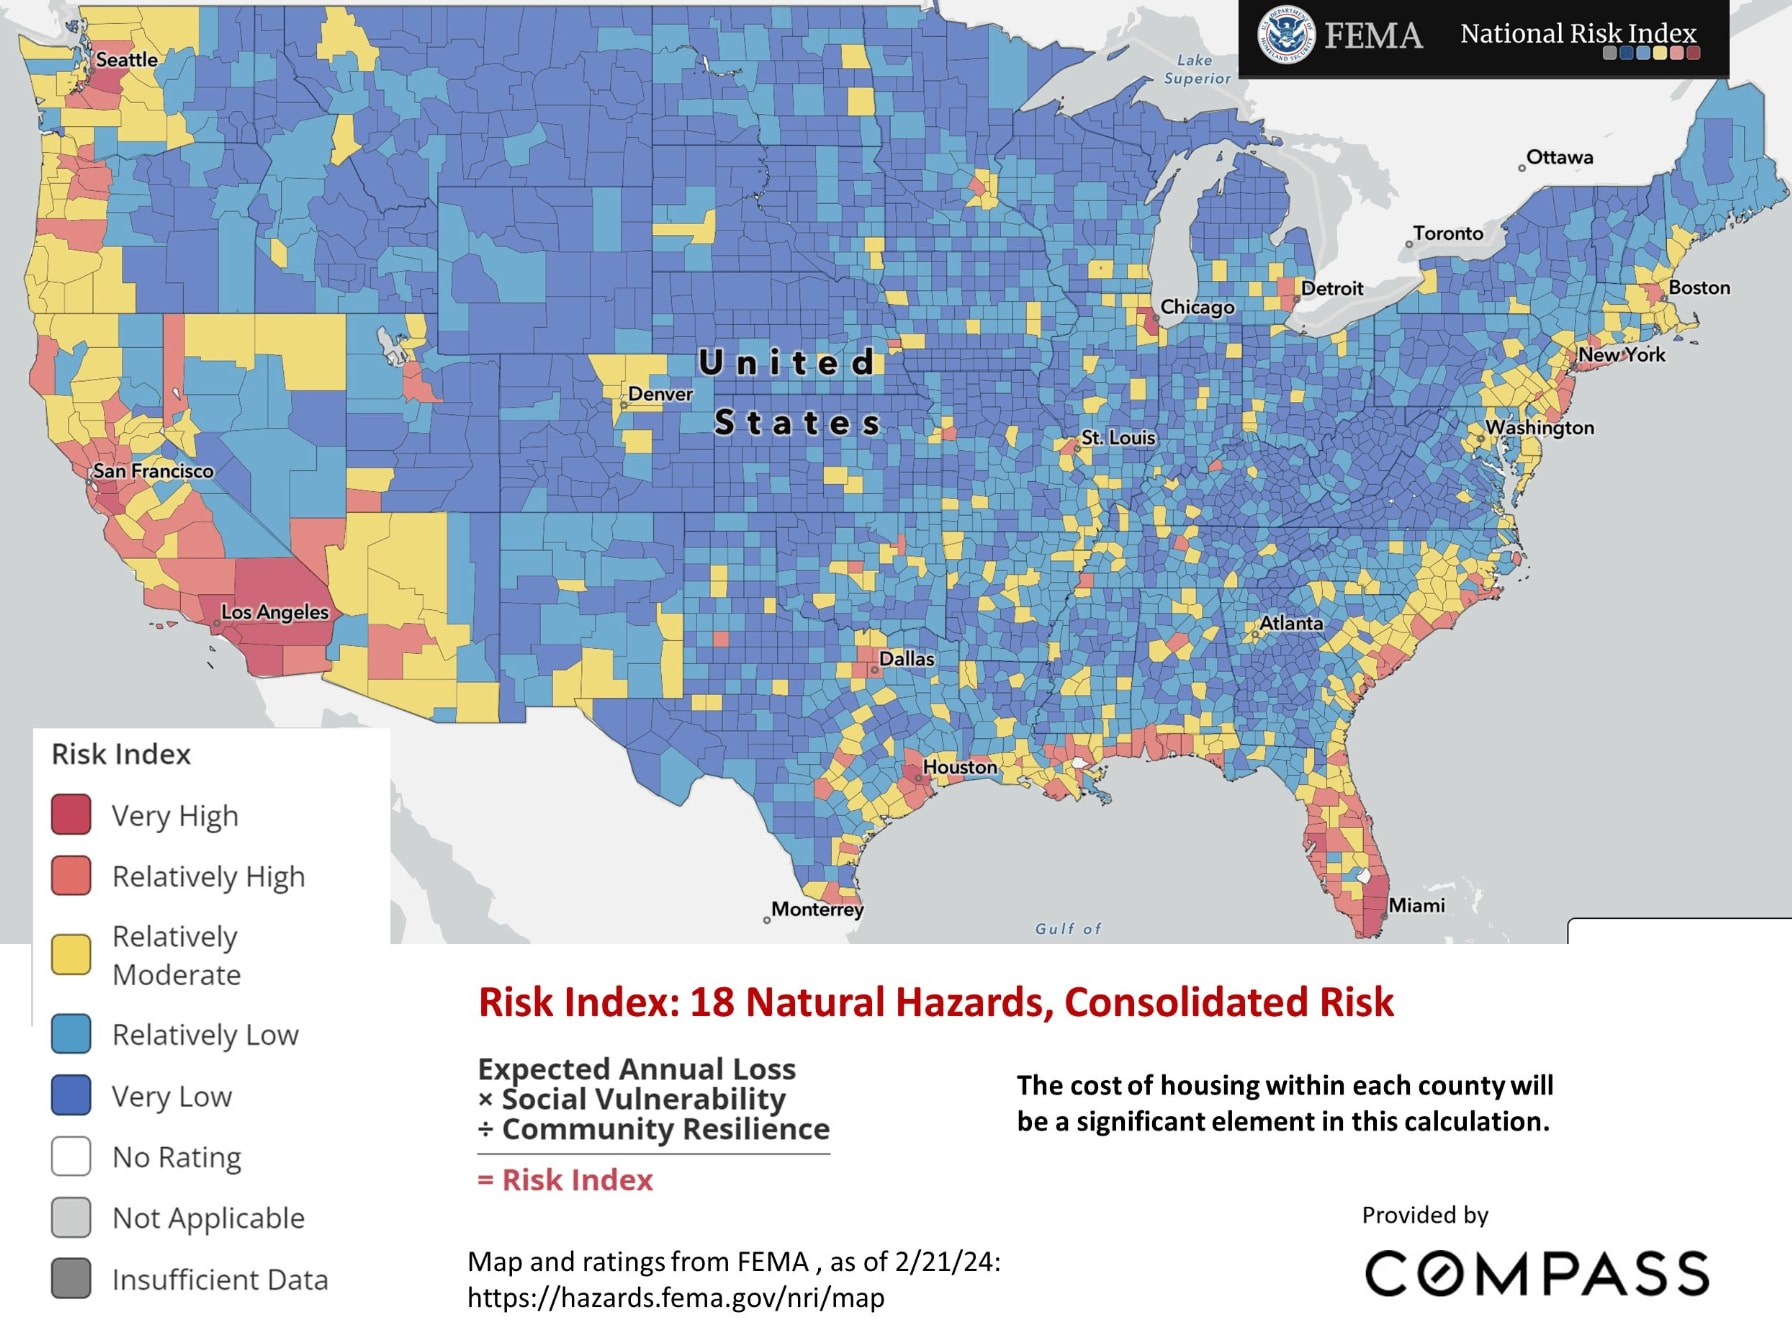
FEMA evaluates social and economic risk against 18 different natural hazards, including floods, wildfires, earthquakes & hurricanes. Click on the image below to review a series of FEMA's Risk Index maps.
FEMA evaluates social and economic risk against 18 different natural hazards, including floods, wildfires, earthquakes & hurricanes. Click on the image below to review a series of FEMA's Risk Index maps.